
















©The Author(s) 2025.
World J Psychiatry. Oct 19, 2025; 15(10): 108861
Published online Oct 19, 2025. doi: 10.5498/wjp.v15.i10.108861
Published online Oct 19, 2025. doi: 10.5498/wjp.v15.i10.108861
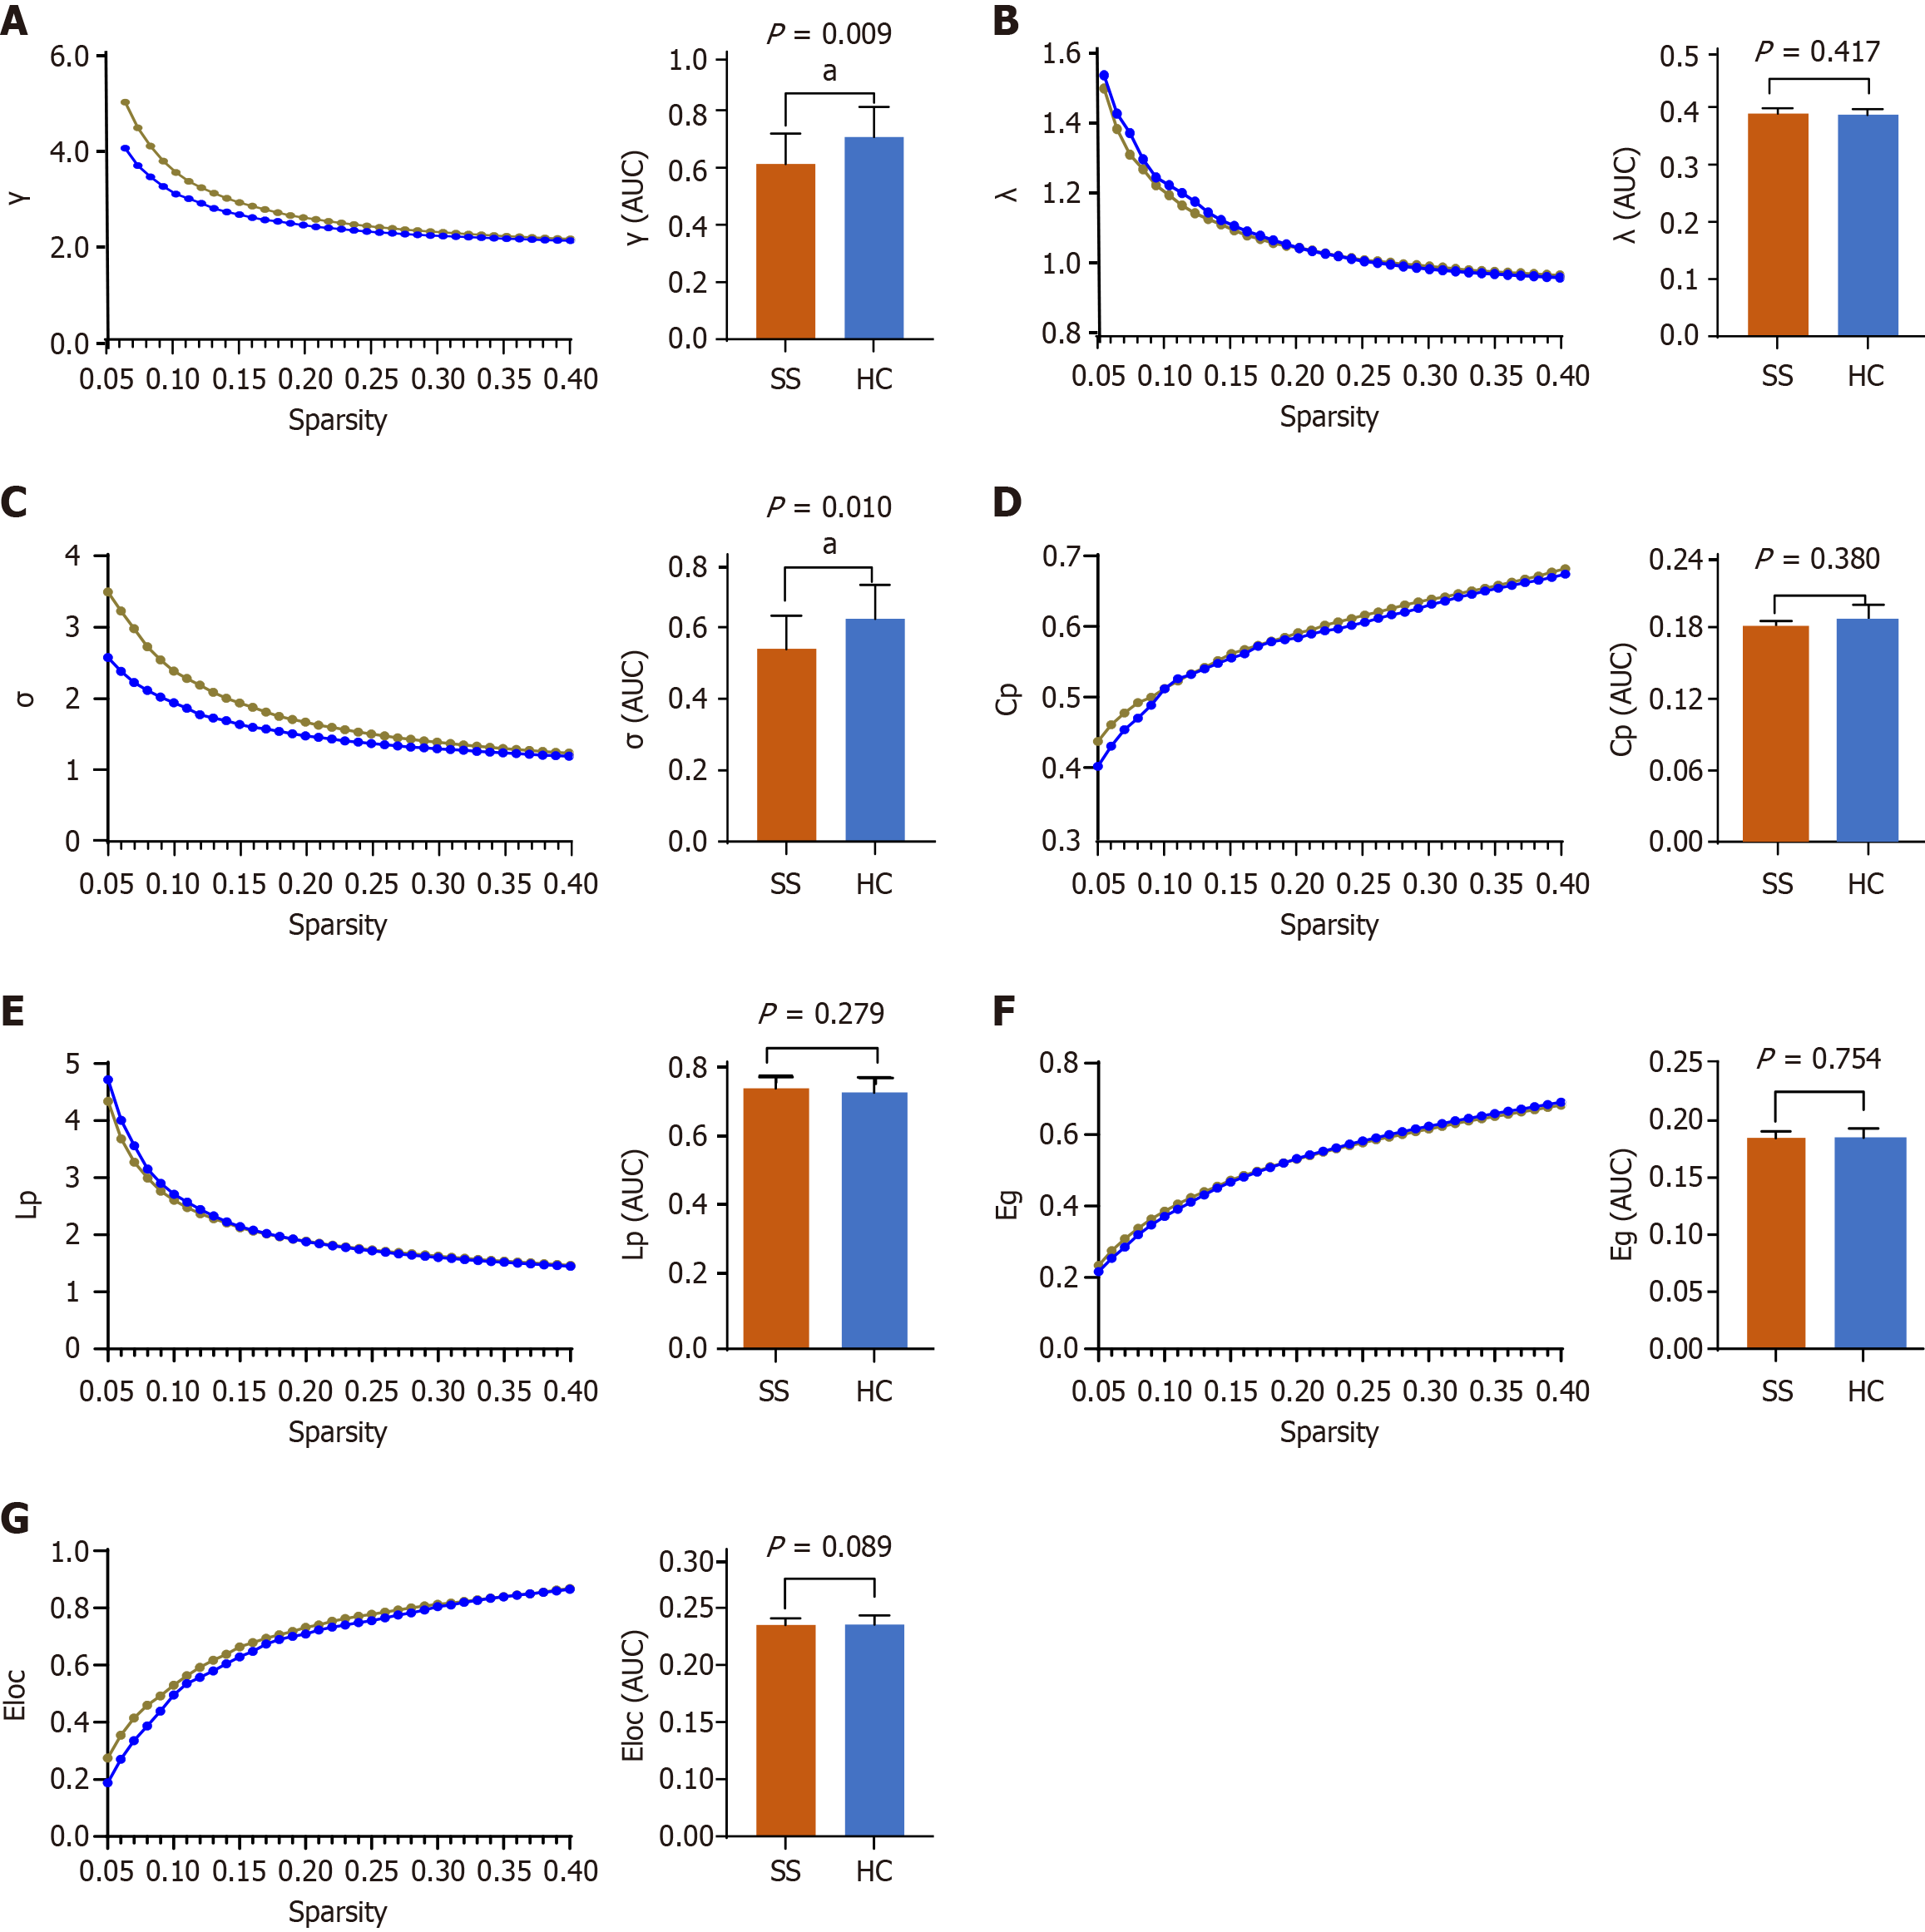
Figure 2 Changes of global properties of the functional brain networks with sparsity and the comparison of area under the curve of global properties.
A: γ of two groups at selected sparsity and comparison the area under the curve (AUC) of γ; B: Λ of two groups at selected sparsity and comparison the AUC of λ; C: Σ of two groups at selected sparsity and comparison the AUC of σ; D: Cp of two groups at selected sparsity and comparison the AUC of Cp; E: Lp of two groups at selected sparsity and comparison the AUC of Lp; F: Eg of two groups at selected sparsity and comparison the AUC of Eg; G: Eloc of two groups at selected sparsity and comparison the AUC of Eloc. SS: Sepsis survivor (orange); HC: Healthy control (blue); AUC: Area under the curve; Cp: Clustering coefficient; Lp: Shortest path length; Eg: Global efficiency; Eloc: Local efficiency. The left column stood for the sparsity range (0.05-0.4). The right column is the area under the curve. aP < 0.05.
- Citation: Li Y, Chen JQ, Wang H, Yang JJ, Ji MH. Frontal, temporal, cerebellar changes link to sepsis survivors' cognitive issues: A resting state functional magnetic resonance imaging study. World J Psychiatry 2025; 15(10): 108861
- URL: https://www.wjgnet.com/2220-3206/full/v15/i10/108861.htm
- DOI: https://dx.doi.org/10.5498/wjp.v15.i10.108861