Copyright
©The Author(s) 2024.
World J Psychiatry. Mar 19, 2024; 14(3): 445-455
Published online Mar 19, 2024. doi: 10.5498/wjp.v14.i3.445
Published online Mar 19, 2024. doi: 10.5498/wjp.v14.i3.445
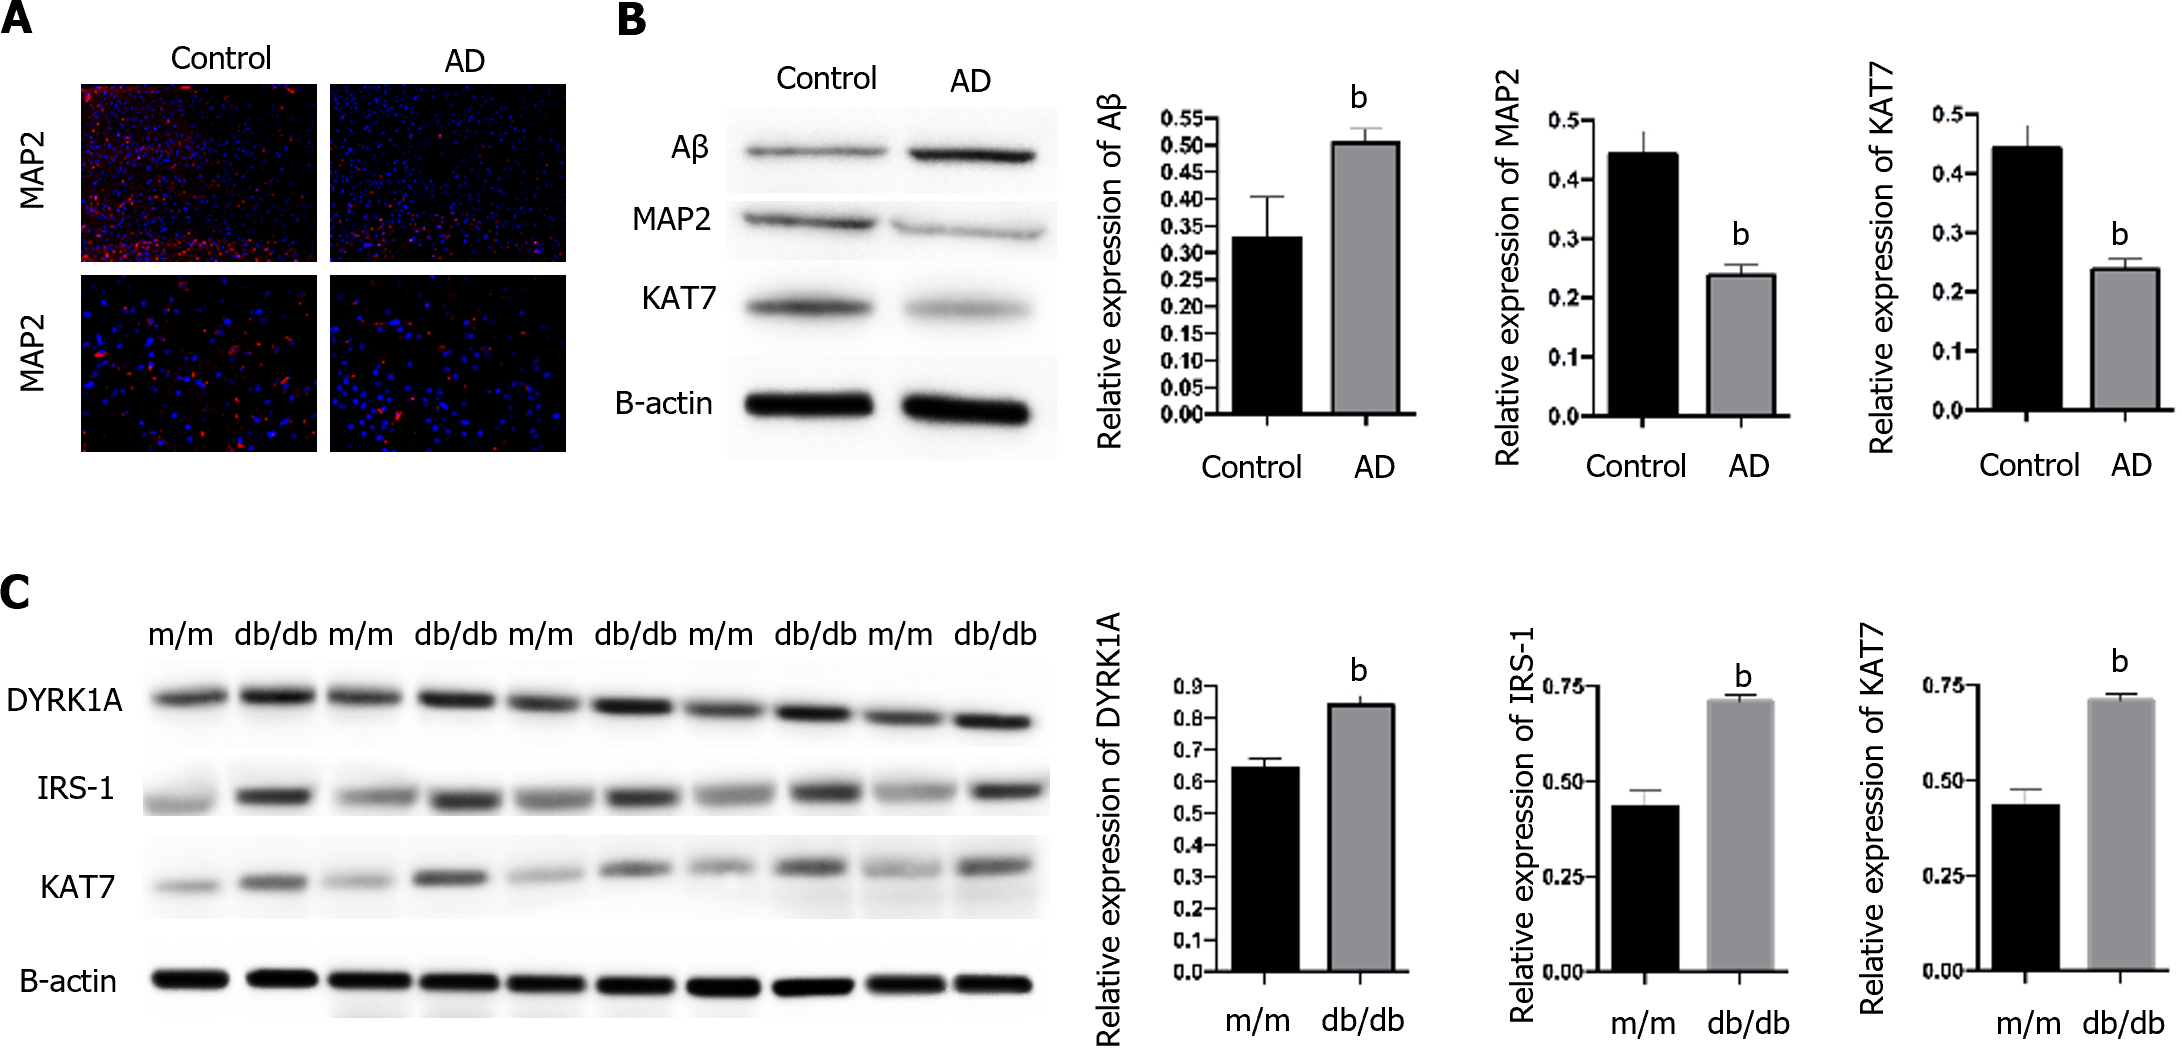
Figure 1 KAT7 expression is correlated with Alzheimer’s disease and insulin resistance.
A: Immunofluorescence staining of MAP2 in brain tissues form Alzheimer’s disease mice and control. Blue, nuclei; Red, MAP2; B: Western blotting assay to evaluate the expression of MAP2, Aβ, and KAT7 in brain tissues. Histogram of relative protein expression in brain tissues form Alzheimer’s disease mice and control; C: Western blotting assay to evaluate the expression of dual-specificity tyrosine phosphorylation-regulated kinase-1A, IRS-1, and KAT7 in brain tissues of diabetic mice (db/db) and control mice (m/m). Histogram of relative protein expression. bP < 0.01. AD: Alzheimer’s disease. DYRK1A: Dual-specificity tyrosine phosphorylation-regulated kinase-1A.
- Citation: Lu QS, Ma L, Jiang WJ, Wang XB, Lu M. KAT7/HMGN1 signaling epigenetically induces tyrosine phosphorylation-regulated kinase 1A expression to ameliorate insulin resistance in Alzheimer’s disease. World J Psychiatry 2024; 14(3): 445-455
- URL: https://www.wjgnet.com/2220-3206/full/v14/i3/445.htm
- DOI: https://dx.doi.org/10.5498/wjp.v14.i3.445


