Copyright
©The Author(s) 2022.
World J Psychiatry. Aug 19, 2022; 12(8): 1016-1030
Published online Aug 19, 2022. doi: 10.5498/wjp.v12.i8.1016
Published online Aug 19, 2022. doi: 10.5498/wjp.v12.i8.1016
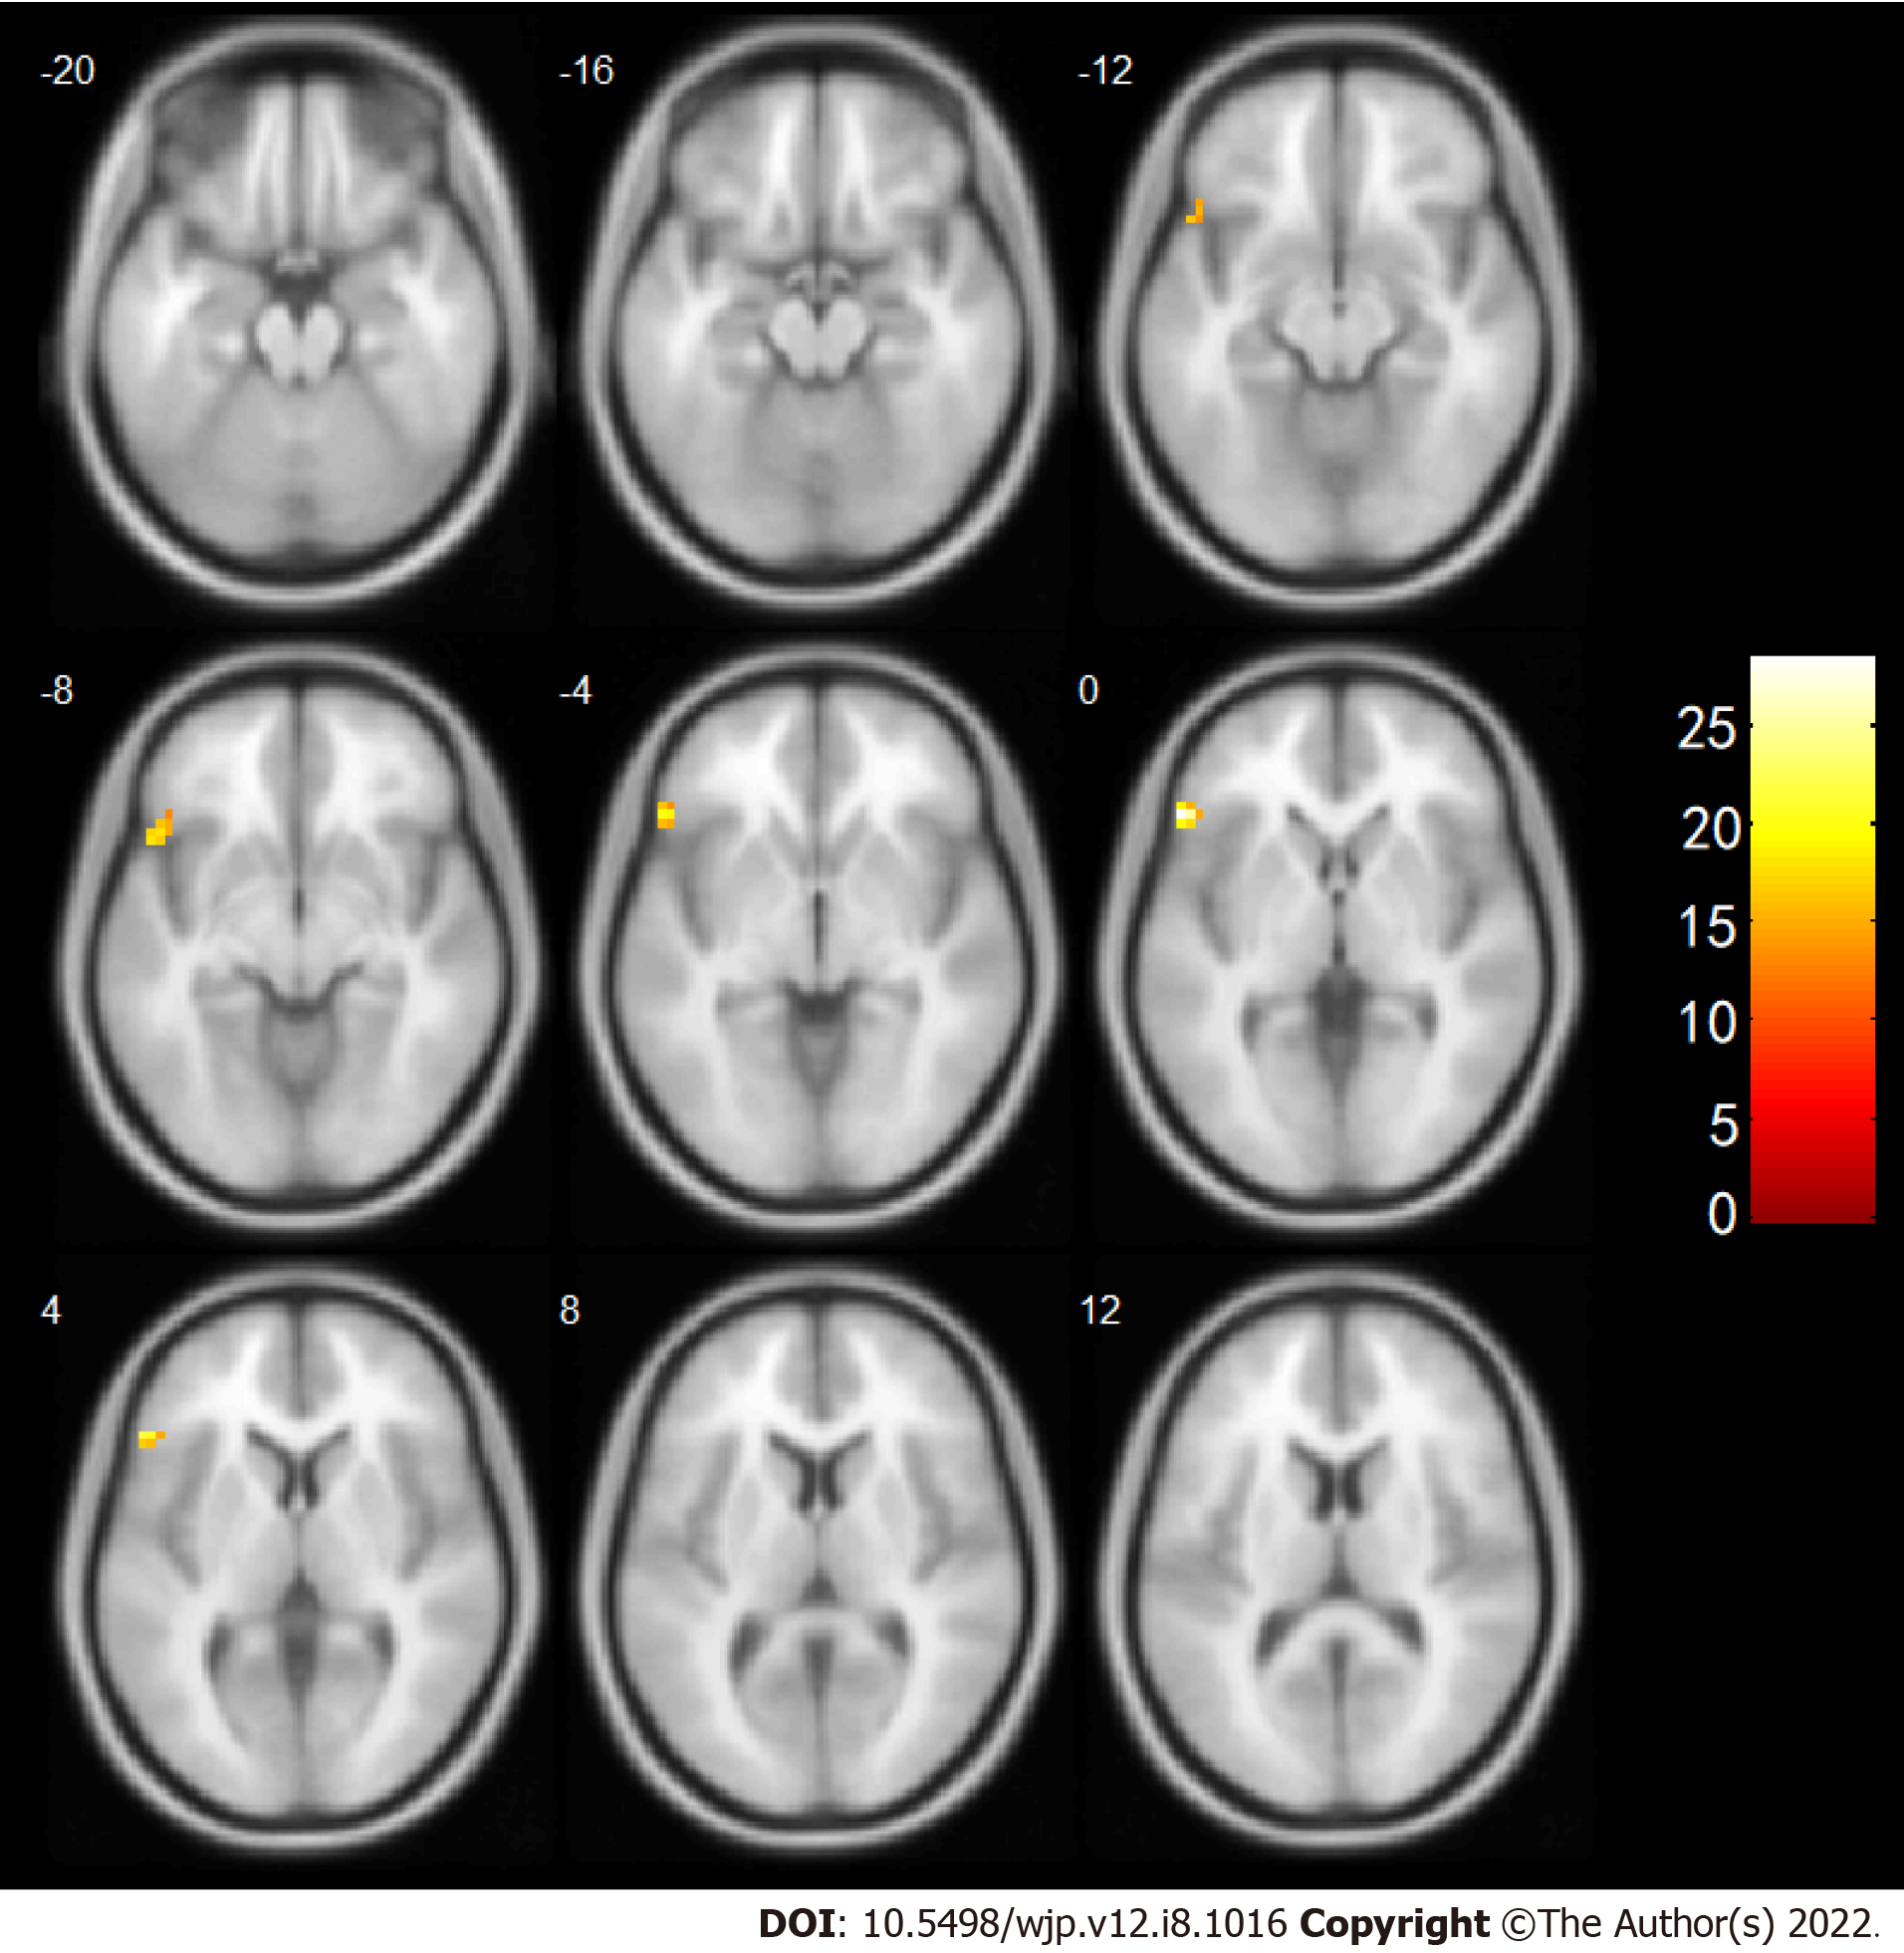
Figure 3 Increased connectivity with the right superior gyrus after intervention.
The numbers in the figure represent the axial coordinates of the brain profile in Montreal Neurological Institute space, and the brightness of the color represents the significance level of the interaction, with brighter color indicating higher significance.
- Citation: Yu RQ, Tan H, Wang ED, Huang J, Wang PJ, Li XM, Zheng HH, Lv FJ, Hu H. Antidepressants combined with psychodrama improve the coping style and cognitive control network in patients with childhood trauma-associated major depressive disorder. World J Psychiatry 2022; 12(8): 1016-1030
- URL: https://www.wjgnet.com/2220-3206/full/v12/i8/1016.htm
- DOI: https://dx.doi.org/10.5498/wjp.v12.i8.1016


