Copyright
©The Author(s) 2024.
World J Psychiatry. Jan 19, 2024; 14(1): 88-101
Published online Jan 19, 2024. doi: 10.5498/wjp.v14.i1.88
Published online Jan 19, 2024. doi: 10.5498/wjp.v14.i1.88
Figure 1 Scatter plots and forest plots of Mendelian randomization effect about 8 metabolites on autism spectrum disorder.
A: Scatter plot and forest plot of Mendelian randomization (MR) effect about M32497:10-undecenoate (11:1n1) on autism spectrum disorder (ASD); B: Scatter plot and forest plot of MR effect about M34420: Des-Arg(9) bradykinin on ASD; C: Scatter plot and forest plot of MR effect about M02137: biliverdin on ASD; D: Scatter plot and forest plot of MR effect about M20675: 1,5-anhydroglucitol on ASD; E: Scatter plot and forest plot of MR effect about M32412: butyrylcarnitine on ASD; F: Scatter plot and forest plot of MR effect about M34407: isovalerylcarnitine on ASD; G: Scatter plot and forest plot of MR effect about M33138: oxidized bilirubin on ASD; H: Scatter plot and forest plot of MR effect about M36131: alpha-glutamyltyrosine on ASD. MR: Mendelian randomization; SNP: Single nucleotide polymorphism.
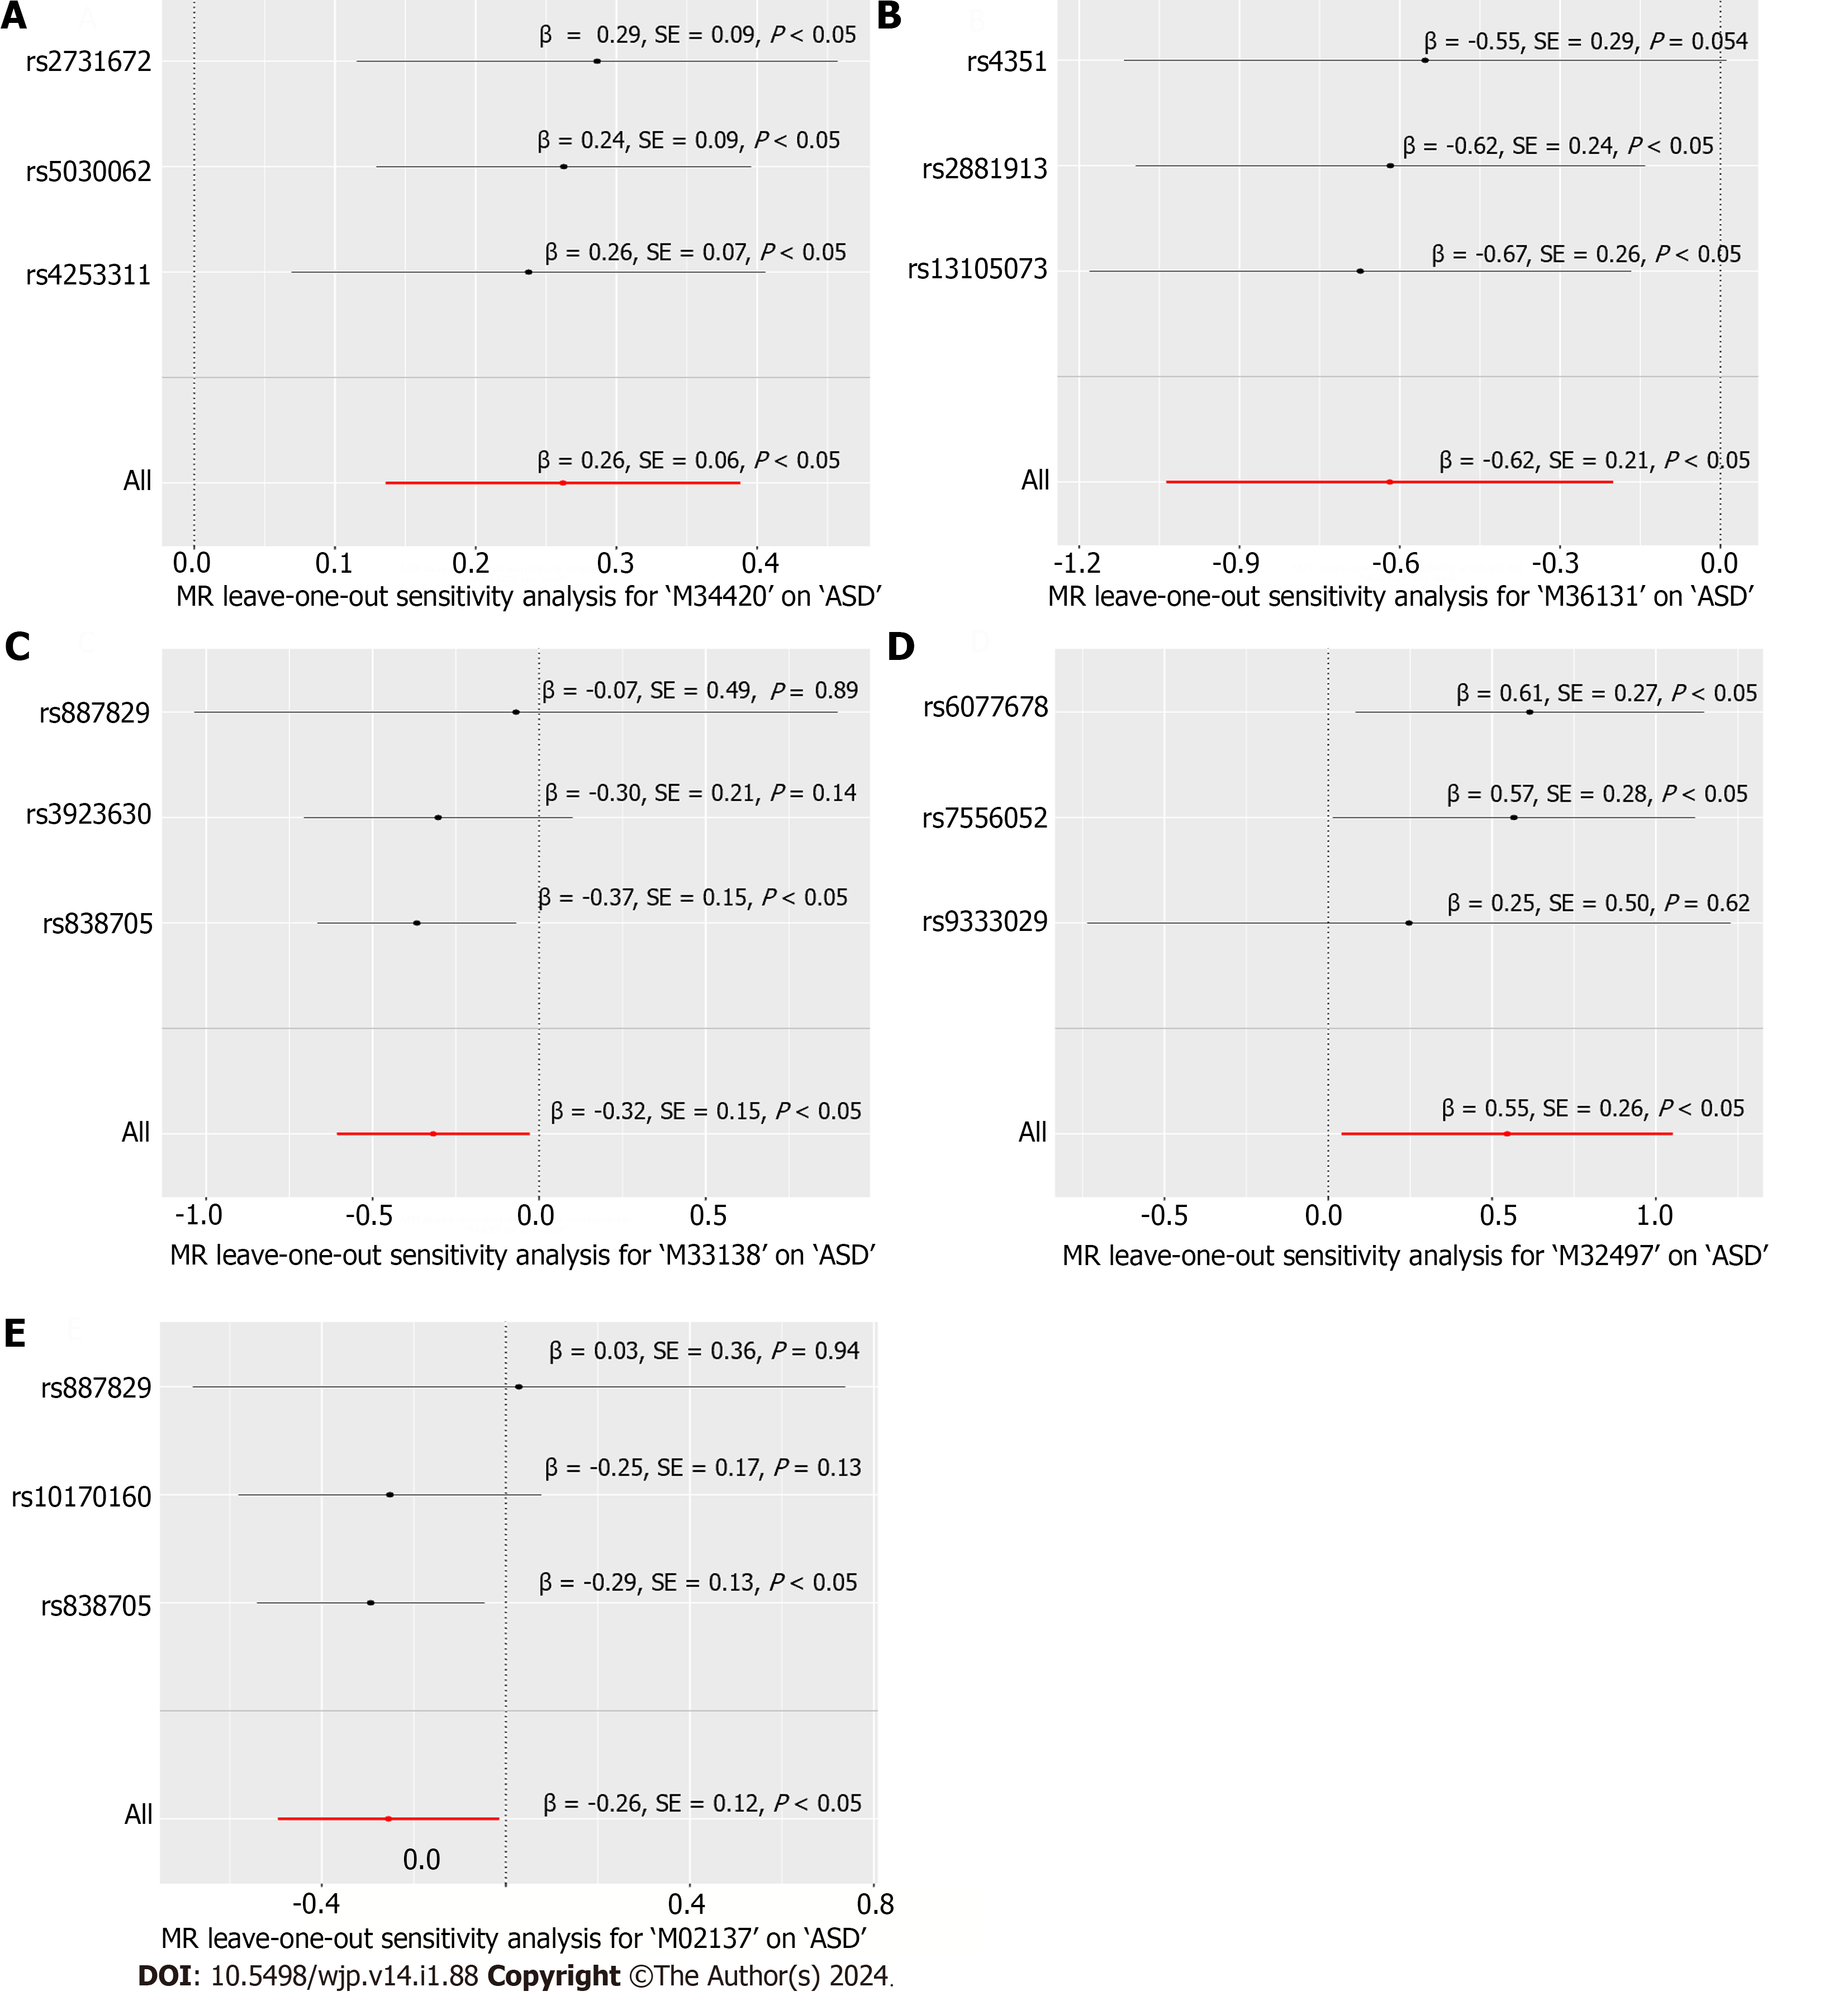
Figure 2 Leave-one-out sensitivity plots of 5 metabolites on autism spectrum disorder.
A: Mendelian randomization (MR) leave-one-out sensitivity analysis for M34420: Des-Arg(9) bradykinin on autism spectrum disorder (ASD); B: MR leave-one-out sensitivity analysis for M36131: alpha-glutamyltyrosine on ASD; C: MR leave-one-out sensitivity analysis for M33138: oxidized bilirubin on ASD; D: MR leave-one-out sensitivity analysis for M32497: 10-undecenoate (11:1n1) on ASD; E: MR leave-one-out sensitivity analysis for M02137: biliverdin on ASD. MR: Mendelian randomization.
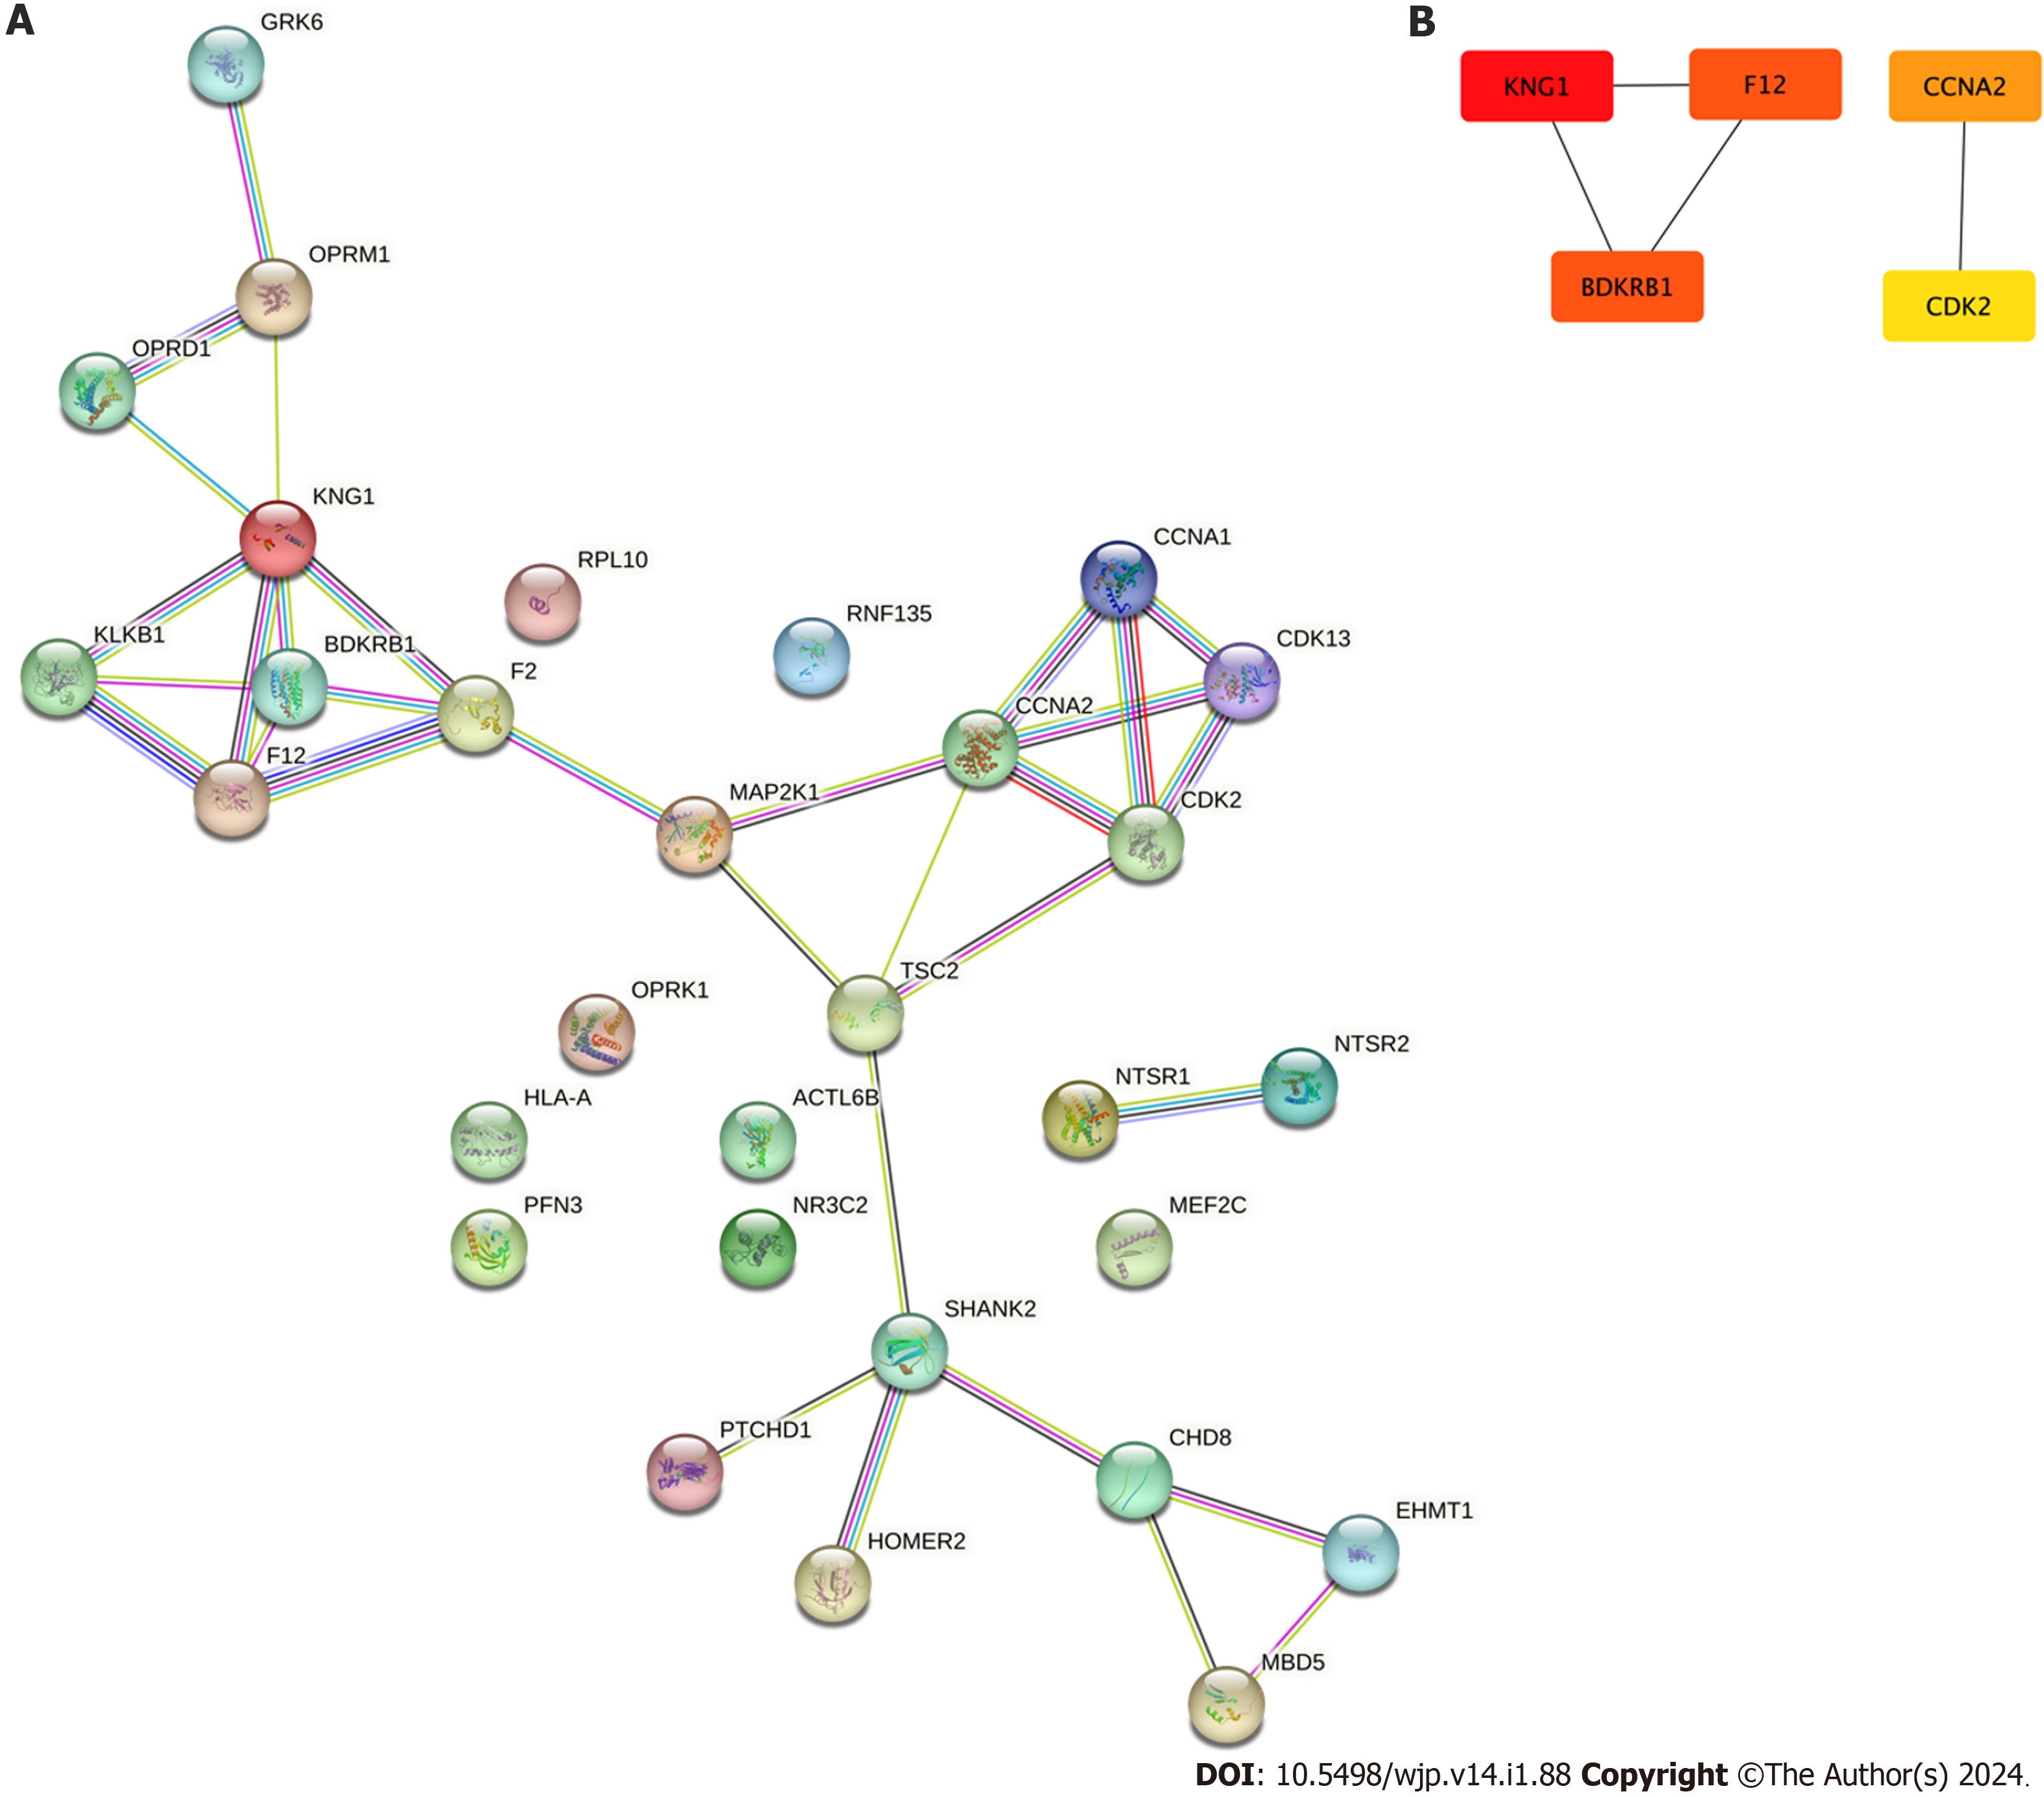
Figure 3 Protein-protein interaction between Des-Arg(9) related targets and Austism related genes.
A: Protein-protein interaction network of Des-Arg(9) bradykinin and autism spectrum disorder (ASD) related genes; B: Five hub genes of the protein-protein interaction network of Des-Arg(9) bradykinin and ASD related genes.
Figure 4 Annotation of the genes in the interaction network.
A: Enrichment analysis results of pathways; B: Enrichment analysis results of gene ontology biological process.
- Citation: Huang ZY, Lyu ZP, Li HG, You HZ, Yang XN, Cha CH. Des-Arg(9) bradykinin as a causal metabolite for autism spectrum disorder. World J Psychiatry 2024; 14(1): 88-101
- URL: https://www.wjgnet.com/2220-3206/full/v14/i1/88.htm
- DOI: https://dx.doi.org/10.5498/wjp.v14.i1.88


