Copyright
©The Author(s) 2022.
World J Clin Infect Dis. Apr 26, 2022; 12(1): 1-19
Published online Apr 26, 2022. doi: 10.5495/wjcid.v12.i1.1
Published online Apr 26, 2022. doi: 10.5495/wjcid.v12.i1.1
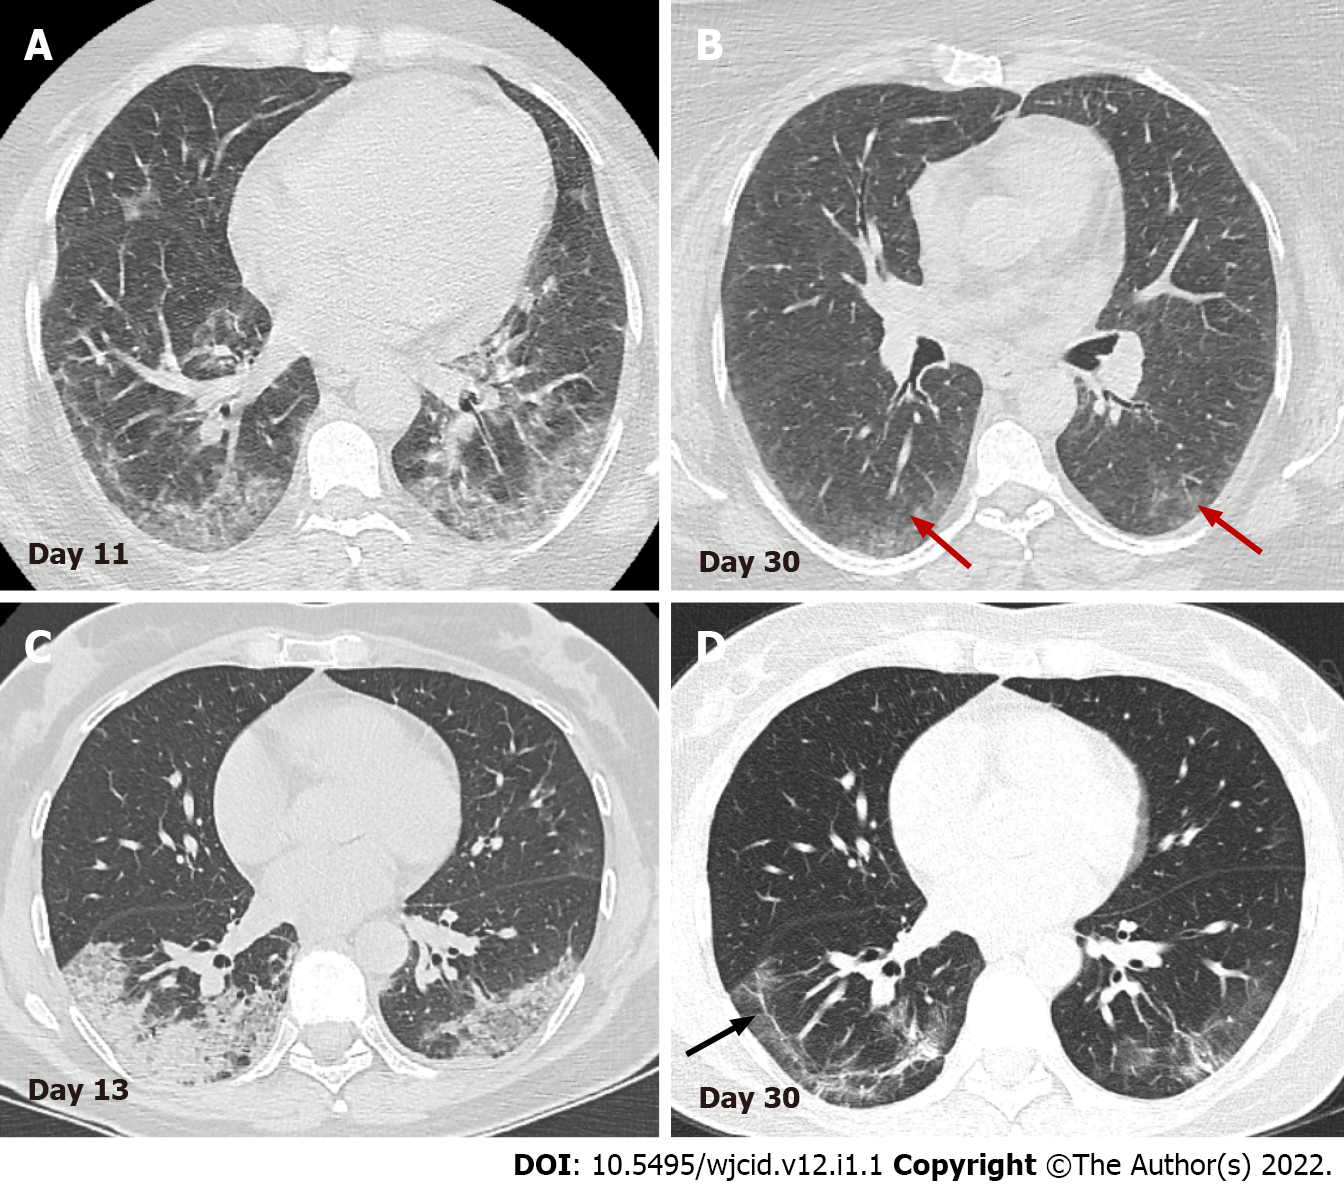
Figure 12 Serial axial computed tomography images.
Serial axial computed tomography images in two different patients show gradual decrease of GGO and consolidations in the late stage of disease (B) and (D). In patient 1 (A) and (B) advanced resorption of the abnormalities is seen with very low density GGO at the sight of previous lung changes (red arrows). In patient 2 (C) and (D) architectural distortion with fibrous bands parallel to the pleura (black arrow) and traction bronchiectasis are visualized (arrowheads).
- Citation: Ilieva E, Boyapati A, Chervenkov L, Gulinac M, Borisov J, Genova K, Velikova T. Imaging related to underlying immunological and pathological processes in COVID-19. World J Clin Infect Dis 2022; 12(1): 1-19
- URL: https://www.wjgnet.com/2220-3176/full/v12/i1/1.htm
- DOI: https://dx.doi.org/10.5495/wjcid.v12.i1.1


