
















©The Author(s) 2022.
World J Clin Infect Dis. Apr 26, 2022; 12(1): 1-19
Published online Apr 26, 2022. doi: 10.5495/wjcid.v12.i1.1
Published online Apr 26, 2022. doi: 10.5495/wjcid.v12.i1.1
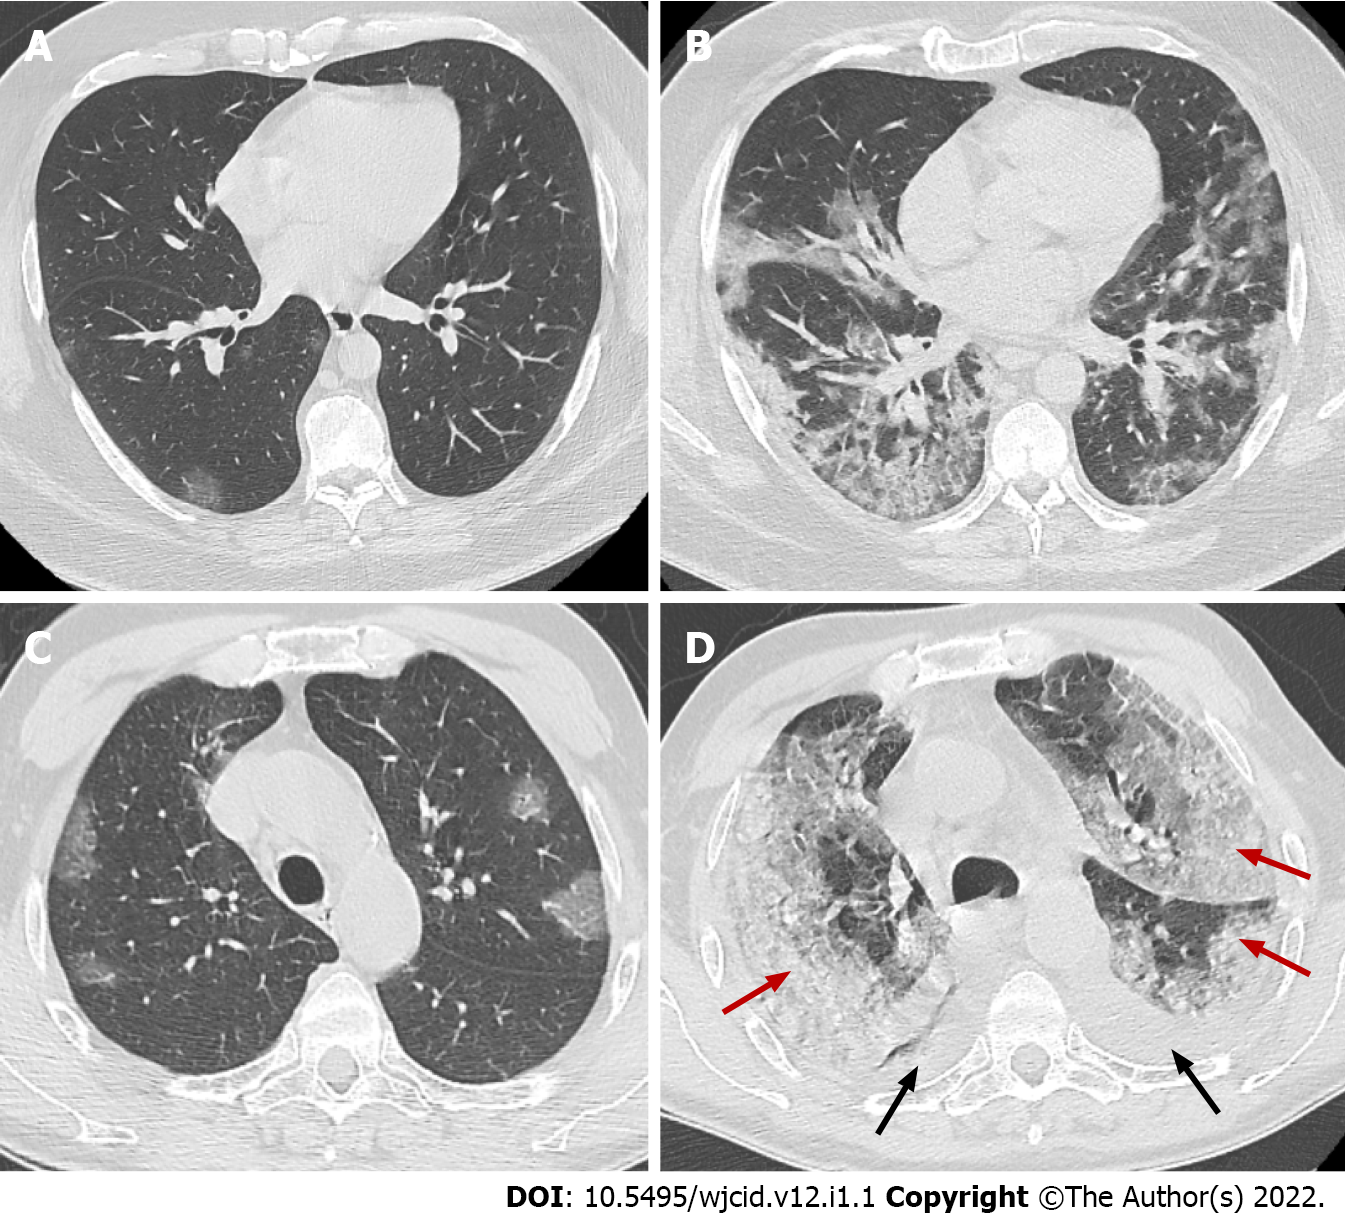
Figure 11 Axial computed tomography images.
Axial computed tomography images on day 2 (A) and day 10 (B) from onset of symptoms of patient with clinical worsening demonstrate increased ground-glass opacities with confluence, crazy-paving appearance and typical peripheral subpleural location, early (A) and progressive (B) stage. Axial images from CT on day 5 (C) and day 15 (D) from onset of symptoms of patient with pronounced clinical worsening demonstrate increased ground-glass opacities with confluence, crazy-paving appearance and extensive areas of consolidation (red arrows) with predominant posterior and lateral distribution. In addition, bilateral pleural effusions (black arrows) are noted, early (C) and peak (D) stage.
- Citation: Ilieva E, Boyapati A, Chervenkov L, Gulinac M, Borisov J, Genova K, Velikova T. Imaging related to underlying immunological and pathological processes in COVID-19. World J Clin Infect Dis 2022; 12(1): 1-19
- URL: https://www.wjgnet.com/2220-3176/full/v12/i1/1.htm
- DOI: https://dx.doi.org/10.5495/wjcid.v12.i1.1