Copyright
©The Author(s) 2019.
World J Hypertens. May 10, 2019; 9(2): 17-29
Published online May 10, 2019. doi: 10.5494/wjh.v9.i2.17
Published online May 10, 2019. doi: 10.5494/wjh.v9.i2.17
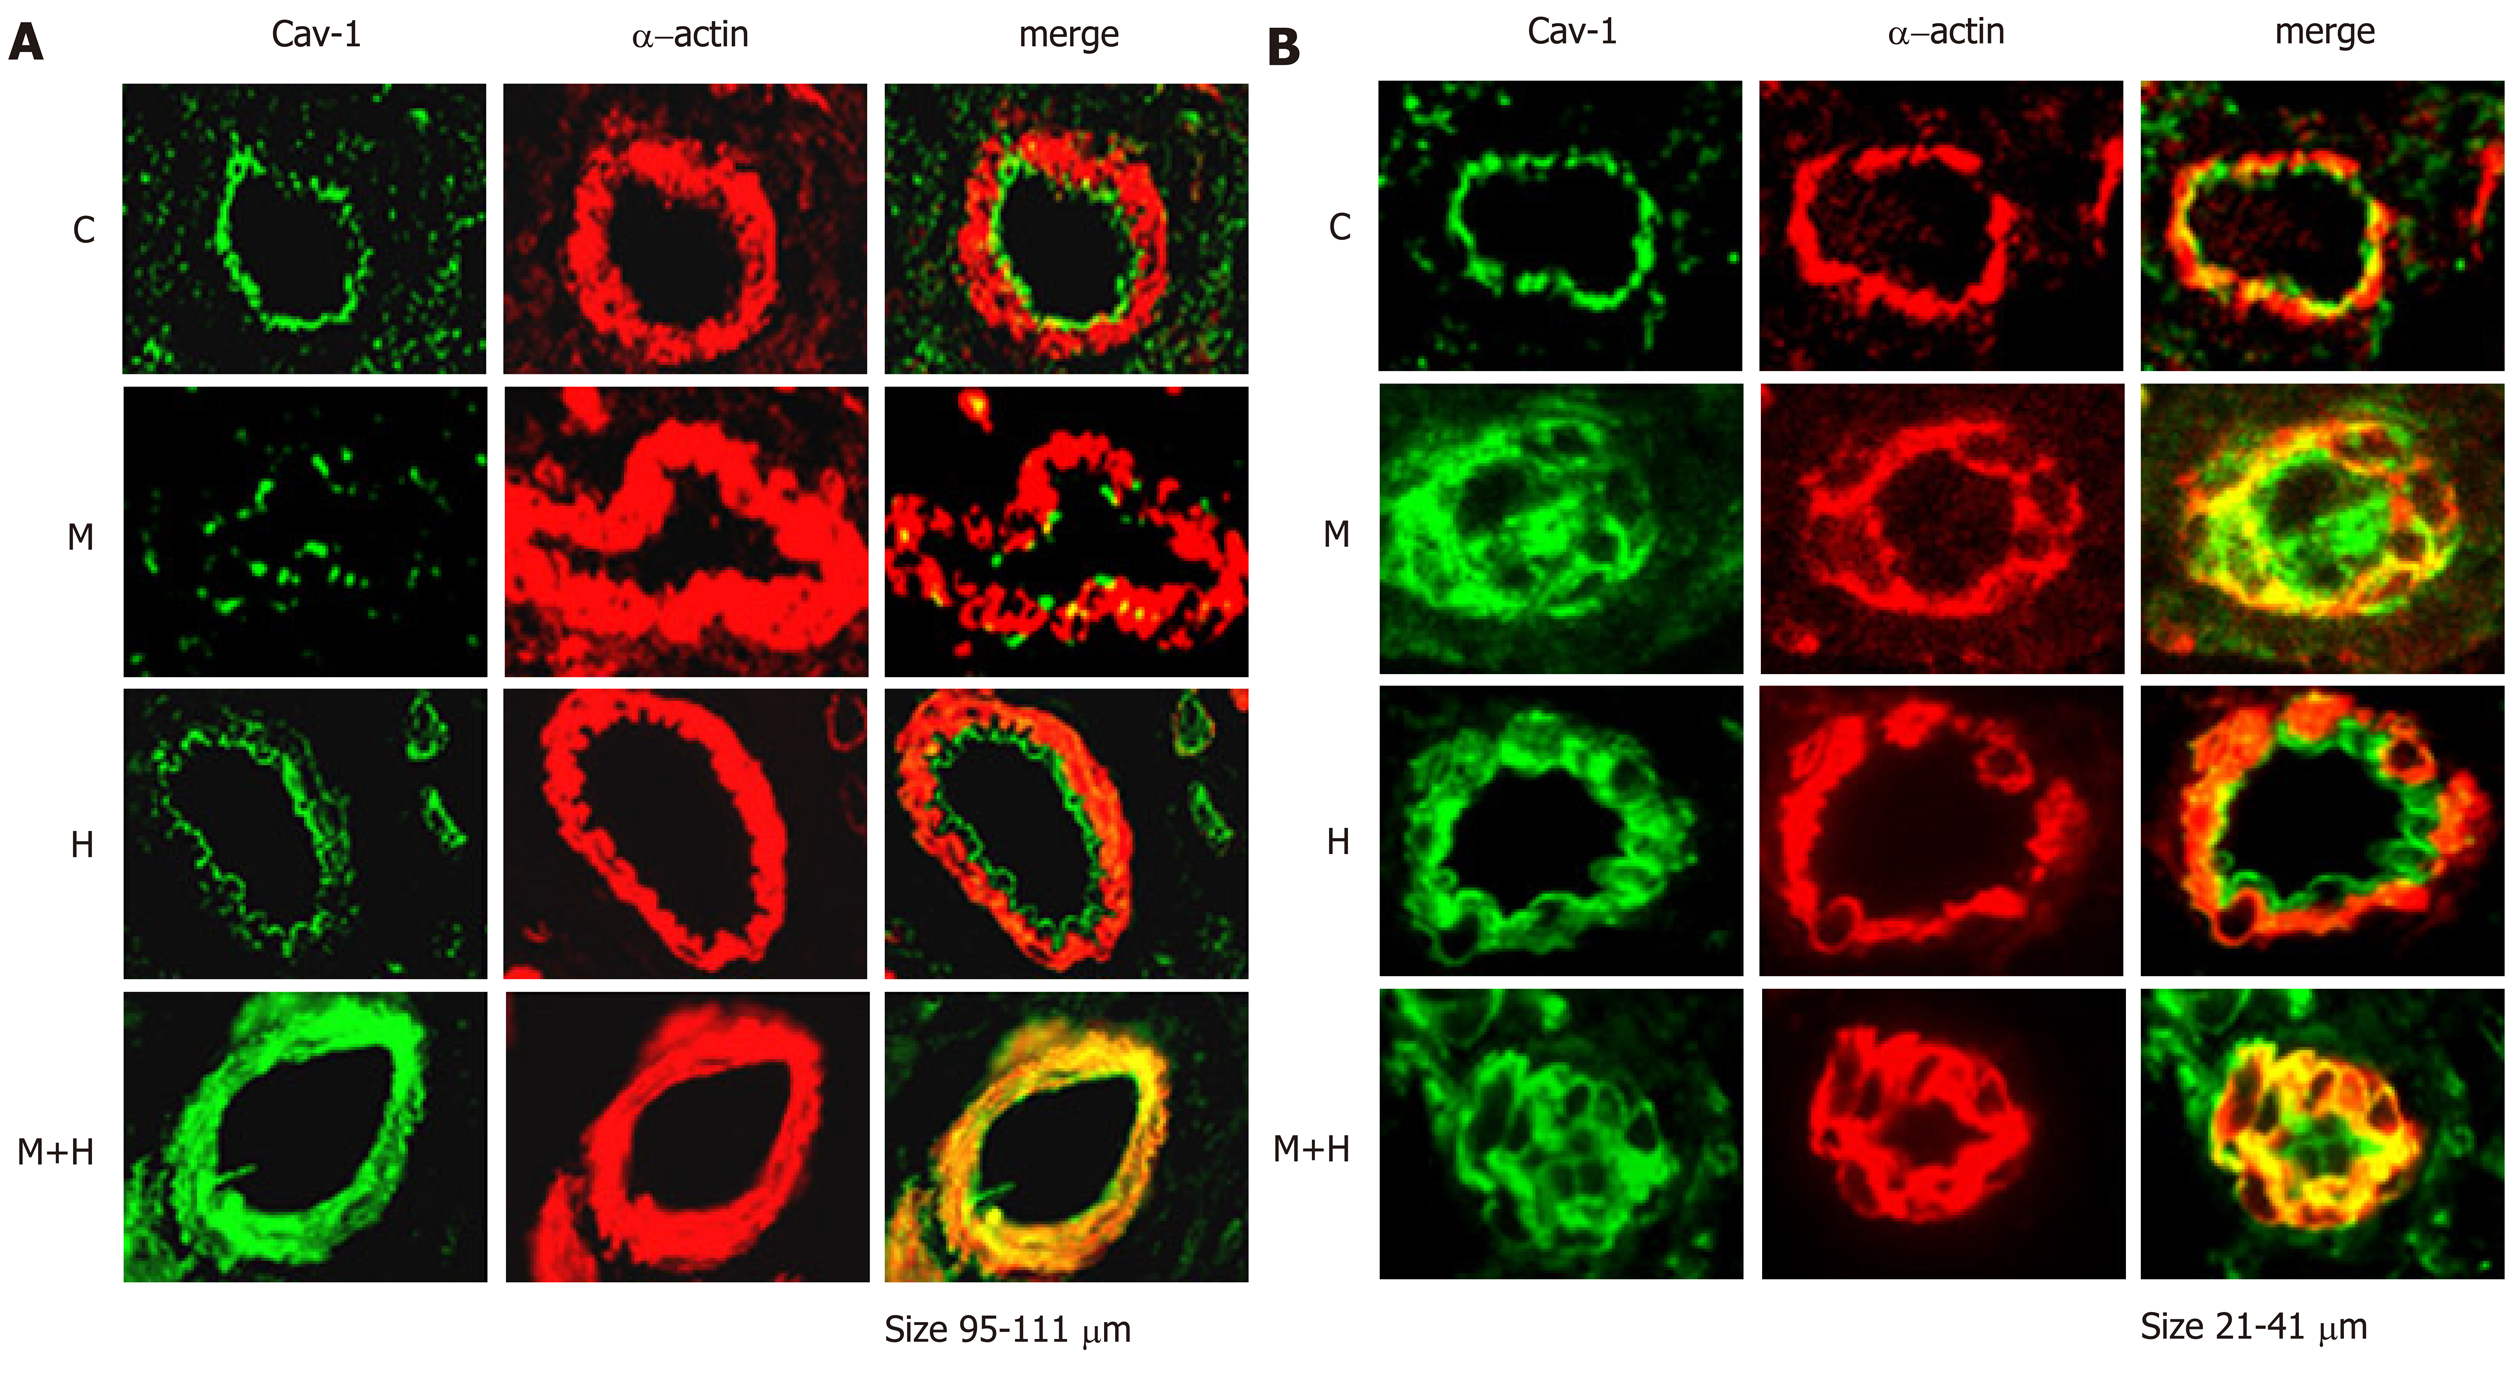
Figure 3 Double immunofluorescence study showing the expression of cav-1 (green) and smooth muscle α-actin (red) in pulmonary arteries from control (C), Monocrotaline (MCT, M), H (hypoxia) and MCT + hypoxia (M+H) groups.
A: Arteries (size 95-111 μm) from C and H depict well preserved cav-1 expression in the endothelial layer and no evidence of enhanced expression of cav-1 in SMC. Artery from M shows significant loss of endothelial cav-1; and the artery from M+H shows complete loss of endothelial cav-1 and enhanced expression of cav-1 in SMC; B: Arteries (size 21-41 μm) from C and H show well preserved endothelial cav-1 and the absence of enhanced expression of cav-1 in SMC. The arteries from both M and M+H show loss of endothelial cav-1 and enhanced expression of cav-1 in SMC and almost occluded lumen in the M+H.
- Citation: Huang J, Mathew R. Loss of cavin1 and expression of p-caveolin-1 in pulmonary hypertension: Possible role in neointima formation. World J Hypertens 2019; 9(2): 17-29
- URL: https://www.wjgnet.com/2220-3168/full/v9/i2/17.htm
- DOI: https://dx.doi.org/10.5494/wjh.v9.i2.17


