Copyright
©The Author(s) 2019.
World J Hypertens. May 10, 2019; 9(2): 17-29
Published online May 10, 2019. doi: 10.5494/wjh.v9.i2.17
Published online May 10, 2019. doi: 10.5494/wjh.v9.i2.17
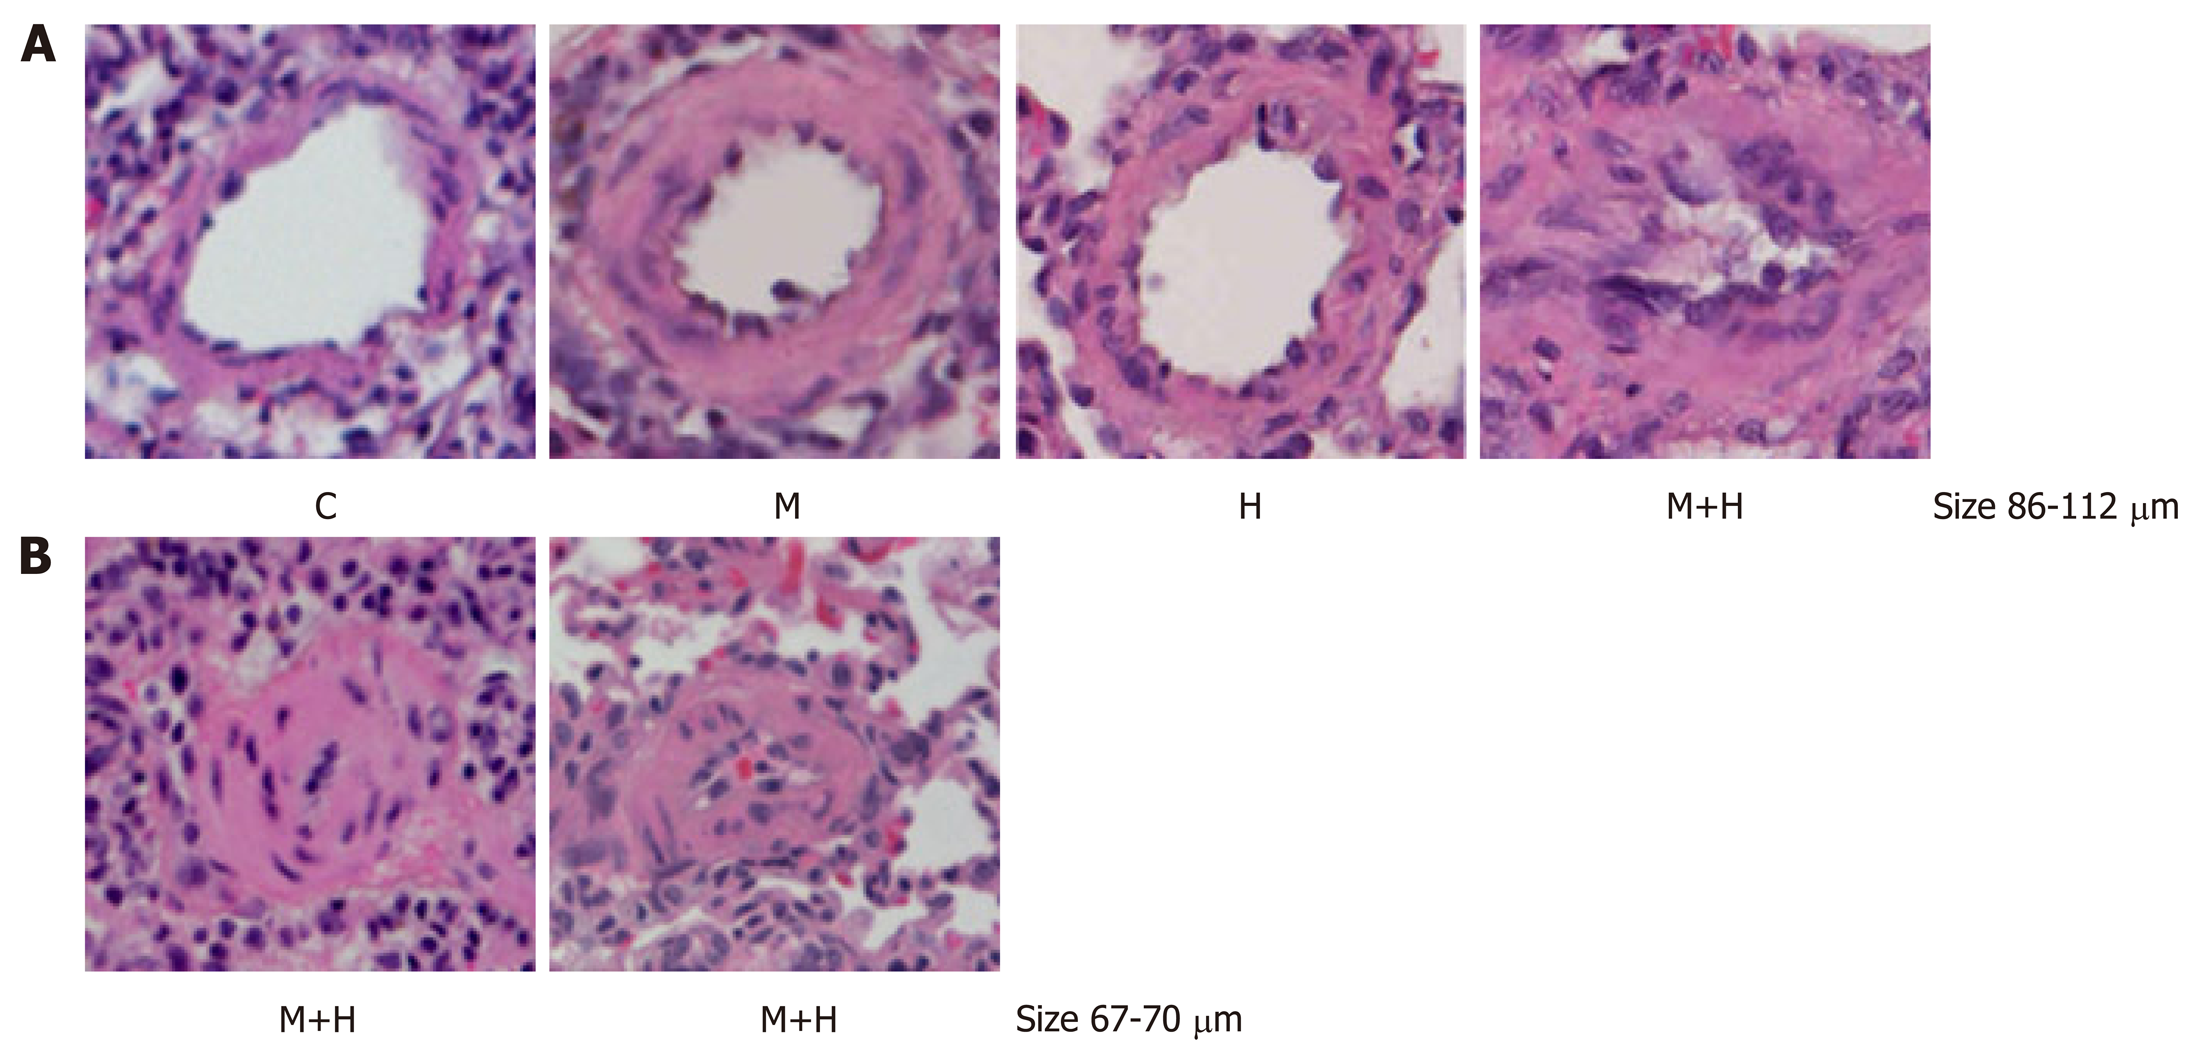
Figure 2 H&E stain of pulmonary arteries from the lungs of control (C), Monocrotaline (MCT, M), hypoxia (H) and MCT+ hypoxia (M+H) groups.
The top row (size 86-111 μm) shows significant medial thickening in the M and H groups; The M+H artery reveals greater medial thickening and neointima. The smaller arteries (size 67-70 μm) from M+H group show almost complete obliteration of the lumen.
- Citation: Huang J, Mathew R. Loss of cavin1 and expression of p-caveolin-1 in pulmonary hypertension: Possible role in neointima formation. World J Hypertens 2019; 9(2): 17-29
- URL: https://www.wjgnet.com/2220-3168/full/v9/i2/17.htm
- DOI: https://dx.doi.org/10.5494/wjh.v9.i2.17


