
















Copyright: ©Author(s) 2026.
World J Exp Med. Mar 20, 2026; 16(1): 115208
Published online Mar 20, 2026. doi: 10.5493/wjem.v16.i1.115208
Published online Mar 20, 2026. doi: 10.5493/wjem.v16.i1.115208
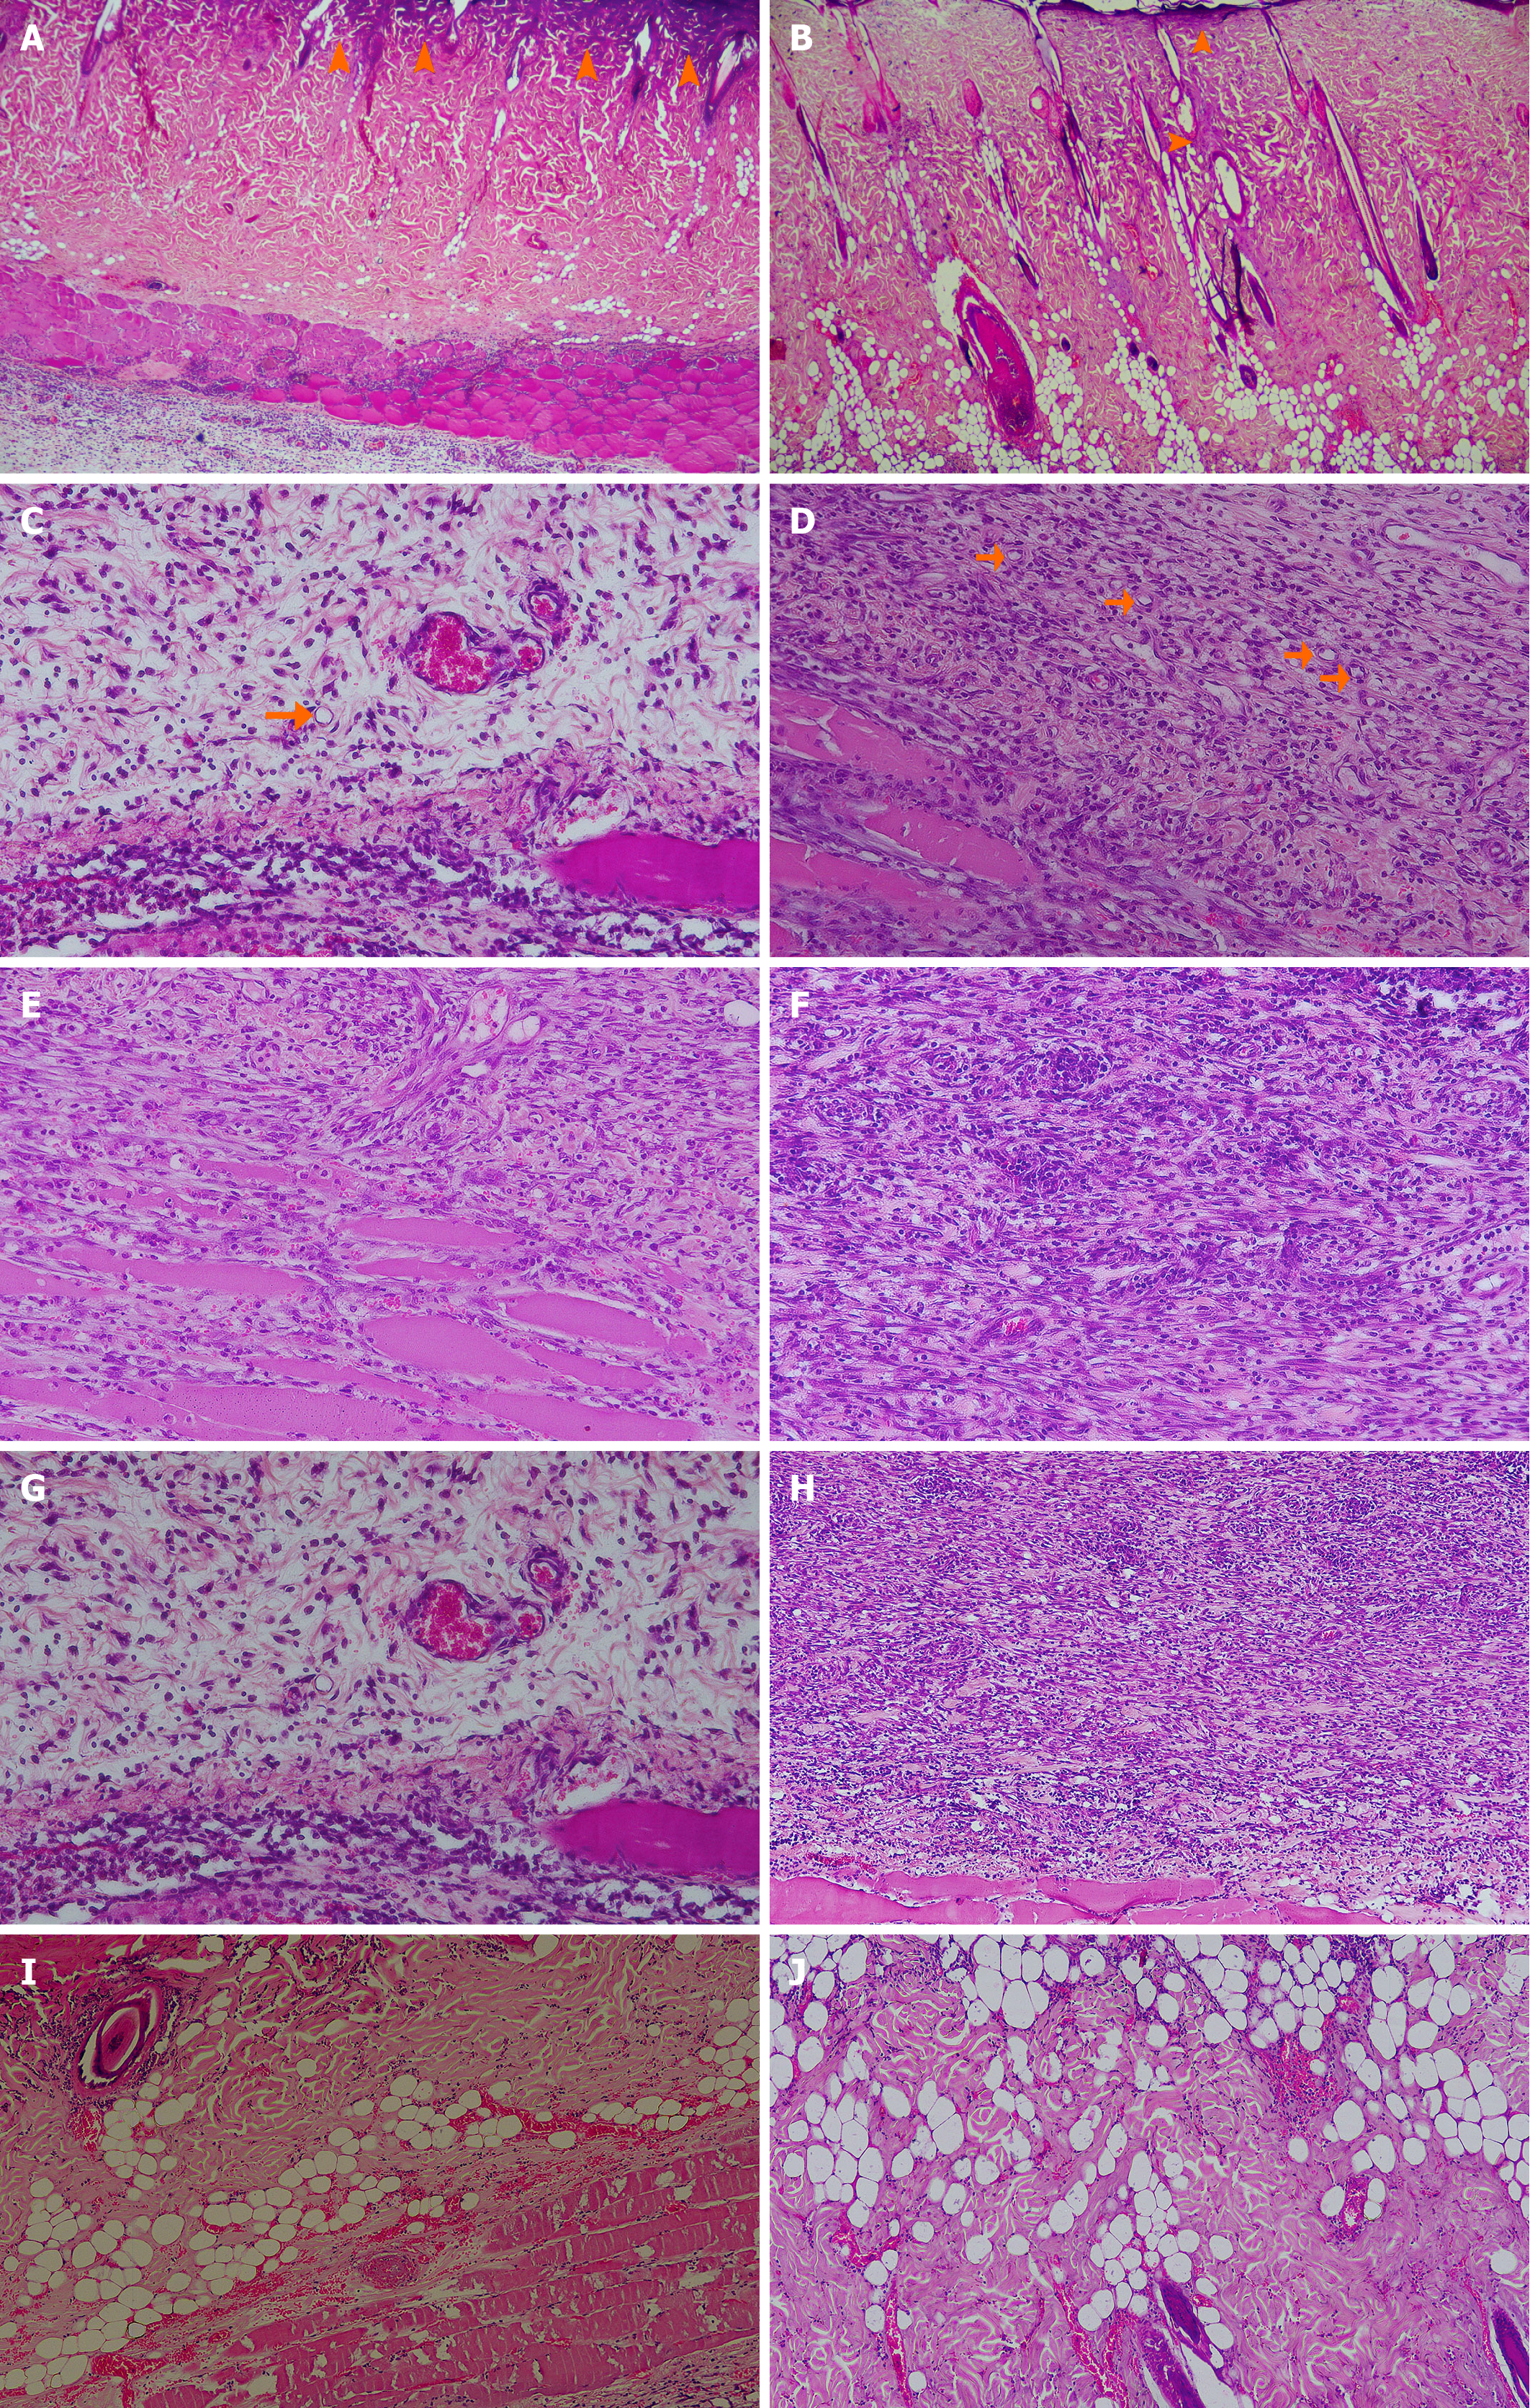
Figure 3 Representative microscopic burn wound healing images.
A: Coagulative necrosis involving the epidermis and superficial dermis, characterized by loss of tissue architecture and magenta staining (arrowheads). Control group, day 9; haematoxylin-eosin (HE) staining, magnification × 40; B: Focal coagulative necrosis observed in skin tissue (arrowheads). Rosuvastatin group, day 9; HE staining, magnification × 40; C: Scant neoplastic capillaries (arrow) corresponding to a low vascular score) observed in a healing area, control group, day 9; HE staining, magnification × 200; D: Highly vascularized connective tissue (arrows) corresponding to a high vascular score, rosuvastatin group, day 9; HE staining, magnification × 20; E: Granulation tissue showing mild to moderate inflammatory cell infiltration (score 1), rosuvastatin group, day 9; HE staining, magnification × 200; F: Granulation tissue showing severe inflammatory cell infiltration (score 2), placebo group, day 9; HE staining, magnification × 200; G: Mild fibroblastic response with moderate fibroblast proliferation and minimal collagen deposition, control group, day 9; HE staining, magnification × 200; H: Marked fibroblastic reaction with extensive fibroblast proliferation and increased collagen deposition, rosuvastatin group, day 9; HE staining, magnification × 100; I: Μicrohemorrhage (small, well-defined area of extravasated red blood cells), placebo group, day 9; HE staining, magnification × 100; J: Multifocal scattered microhemorrhages (small foci of red blood cell extravasation), rosuvastatin group, day 9; HE staining, magnification × 100.
- Citation: Marneri AG, Pavlidis ET, Stavrati KE, Kofinas A, Mouratidou C, Gkoutziotis I, Kotoulas SC, Marouda C, Psalla D, Ballas KD, Pavlidis TE. Experimental beneficial effect of rosuvastatin on burn wound healing in a rat model. World J Exp Med 2026; 16(1): 115208
- URL: https://www.wjgnet.com/2220-315x/full/v16/i1/115208.htm
- DOI: https://dx.doi.org/10.5493/wjem.v16.i1.115208