
















©The Author(s) 2025.
World J Exp Med. Dec 20, 2025; 15(4): 113869
Published online Dec 20, 2025. doi: 10.5493/wjem.v15.i4.113869
Published online Dec 20, 2025. doi: 10.5493/wjem.v15.i4.113869
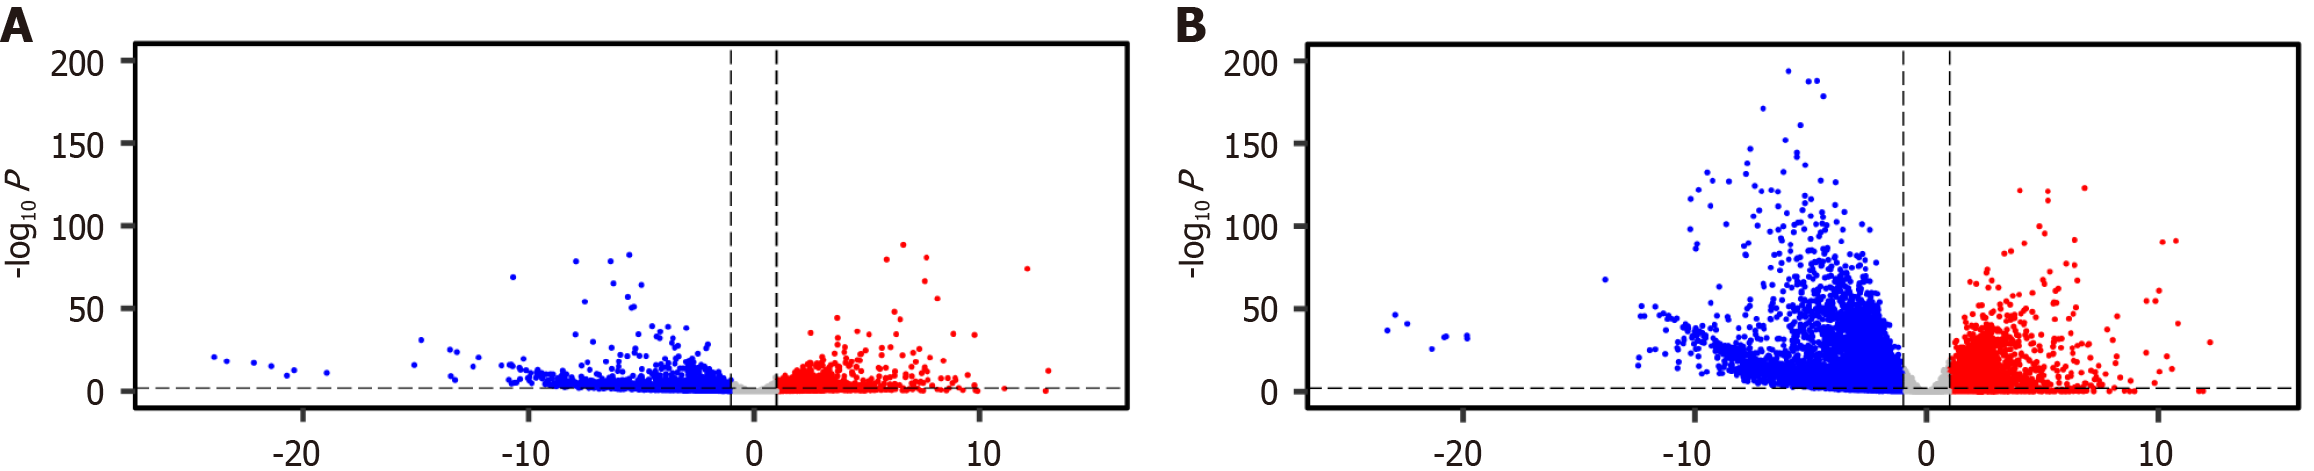
Figure 1 Transcriptome-wide differential expression profiles in vaccine-affected individuals.
A: Volcano plot showing differential gene expression in individuals with new-onset adverse events following messenger RNA (mRNA) coronavirus disease 2019 (COVID-19) vaccination (n = 3) compared to normal controls (n = 803); B: Volcano plot showing differential gene expression in individuals diagnosed with new-onset cancer shortly after receiving mRNA COVID-19 vaccination (n = 7) compared to the same control cohort. Each point represents a single gene plotted by log2 fold change (X-axis) and -log10 adjusted P value (Padj) (Y-axis). Genes with significant upregulation (log2FC > 1, Padj < 0.05) are marked in red, while significantly downregulated genes (log2FC < -1, Padj < 0.05) are shown in blue. Non-significant genes appear in gray. These plots reveal widespread transcriptional dysregulation in both patient groups, serving as the foundation for subsequent pathway enrichment analysis.
- Citation: Von Ranke NL, Zhang W, Anokhin P, Hulscher N, McKernan K, Mccullough P, Catanzaro J. Synthetic messenger RNA vaccines and transcriptomic dysregulation: Evidence from new-onset adverse events and cancers post-vaccination. World J Exp Med 2025; 15(4): 113869
- URL: https://www.wjgnet.com/2220-315x/full/v15/i4/113869.htm
- DOI: https://dx.doi.org/10.5493/wjem.v15.i4.113869