
















©The Author(s) 2025.
World J Exp Med. Dec 20, 2025; 15(4): 110890
Published online Dec 20, 2025. doi: 10.5493/wjem.v15.i4.110890
Published online Dec 20, 2025. doi: 10.5493/wjem.v15.i4.110890
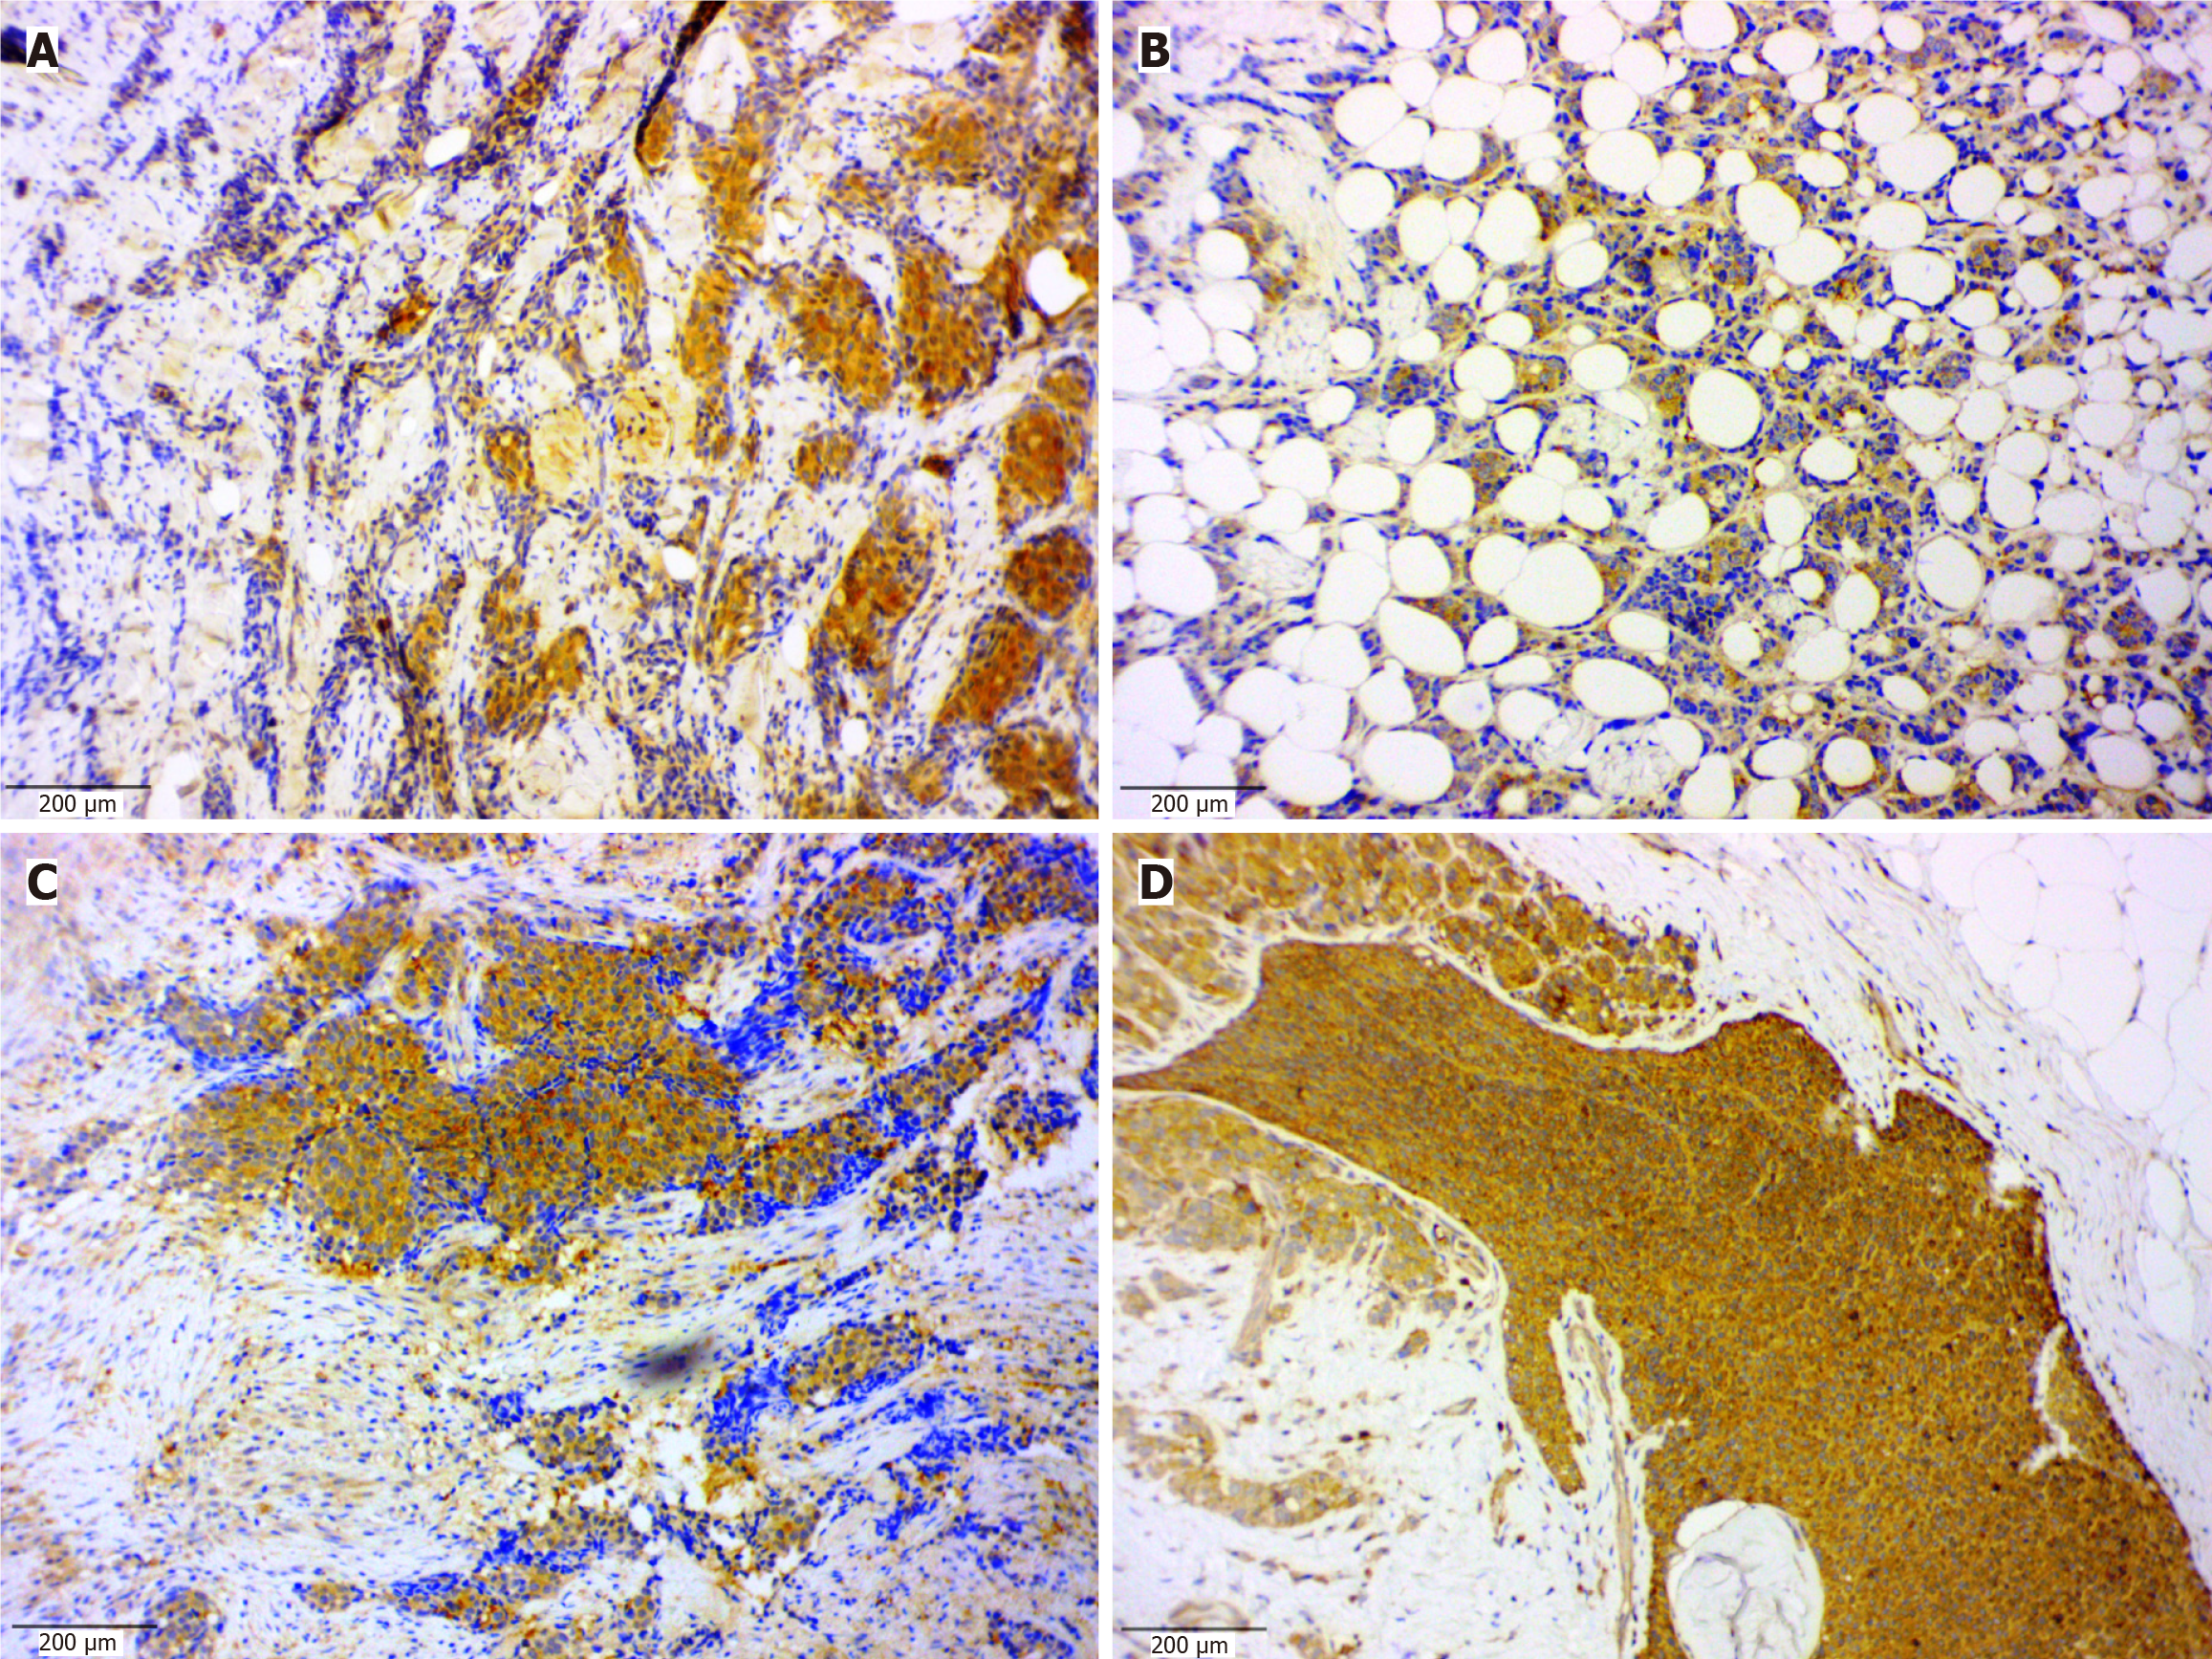
Figure 1 Assessment of the severity of cytoplasmic programmed cell death protein 1 Ligand 1 expression in tumor cells.
A: The percentage of tumor cells (TCs) without staining = 1, the percentage of TCs with weak staining = 0, the percentage of TCs with moderate staining = 2 and the percentage of TCs with strong staining = 1. The severity of cytoplasmic programmed cell death protein 1 ligand 1 (cPDCD1 LG1) expression in TCs = 8 (1 × 0 + 0 × 1 + 2 × 2 + 1 × 3); B: The percentage of TCs without staining = 0, the percentage of TCs with weak staining = 3, the percentage of TCs with moderate staining = 0 and the percentage of TCs with strong staining = 0. The severity of cPDCD1 LG1 expression in TCs = 3 (1 × 0 + 3 × 1 + 0 × 2 + 0 × 3); C: The percentage of TCs without staining = 1; the percentage of TCs with weak staining = 0; the percentage of TCs with moderate staining = 4; and the percentage of TCs with strong staining = 0. The severity of PDCD1 LG1 expression in TCs = 6 (1 × 0 + 0 × 1 + 3 × 2 + 0 × 3); D: The percentage of TCs without staining = 0; the percentage of TCs with weak staining = 0; the percentage of TCs with moderate staining = 1; and the percentage of TCs with strong staining = 3. The severity of PDCD1 LG1 expression in TCs = 11 (0 × 0 + 0 × 1 + 1 × 2 + 3 × 3). Staining with anti-PDCD1 LG1 antibodies. The scale bar is 200 μm.
- Citation: Senchukova MA, Zubareva EY, Saidler NV, Krivolapova LV. Lack of cytoplasmic expression of a new marker programmed cell death ligand-1 in tumor cells is significant. World J Exp Med 2025; 15(4): 110890
- URL: https://www.wjgnet.com/2220-315x/full/v15/i4/110890.htm
- DOI: https://dx.doi.org/10.5493/wjem.v15.i4.110890