
















©The Author(s) 2025.
World J Exp Med. Dec 20, 2025; 15(4): 108187
Published online Dec 20, 2025. doi: 10.5493/wjem.v15.i4.108187
Published online Dec 20, 2025. doi: 10.5493/wjem.v15.i4.108187
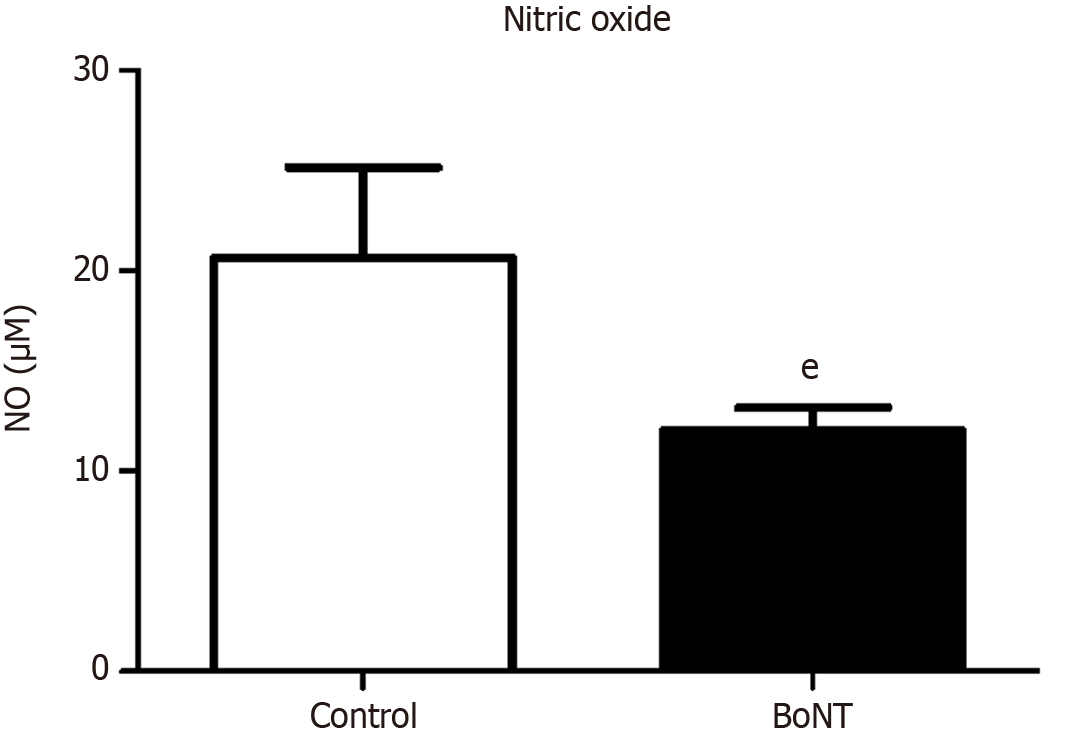
Figure 5 Level of nitric oxide.
The bar graph represents the level of nitric oxide (NO) in the hippocampus of aging experimental mice. The level of NO was found to be decreased in the botulinum neurotoxin treated group when compared to the control group (eP value ≤ 0.05). NO: Nitric oxide; BoNT: Botulinum neurotoxin.
- Citation: Joseph JHM, Babu Deva Irakkam MP, Kandasamy M. Proneurogenic and microglial modulatory properties of botulinum neurotoxin in the hippocampus of aging experimental mice. World J Exp Med 2025; 15(4): 108187
- URL: https://www.wjgnet.com/2220-315x/full/v15/i4/108187.htm
- DOI: https://dx.doi.org/10.5493/wjem.v15.i4.108187