Copyright
©The Author(s) 2015.
World J Exp Med. Aug 20, 2015; 5(3): 194-199
Published online Aug 20, 2015. doi: 10.5493/wjem.v5.i3.194
Published online Aug 20, 2015. doi: 10.5493/wjem.v5.i3.194
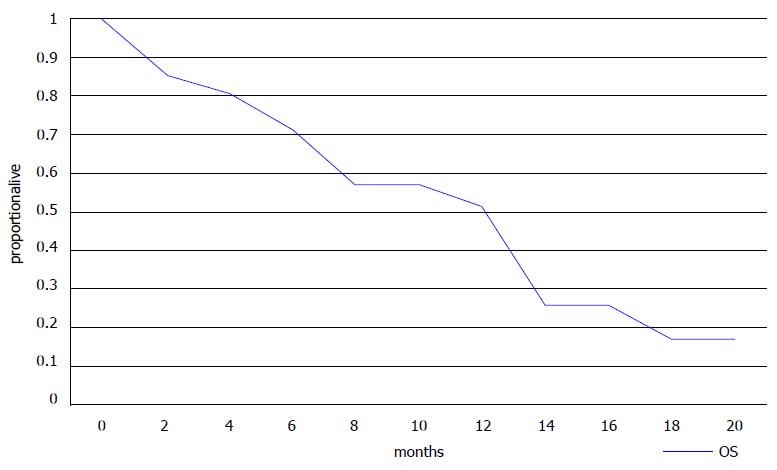
Figure 2 Kaplan-Meier curve of Overall Survival of the patients in this series.
The Y axis depicts the percentage of patients alive and the X axis represents months from the start of eribulin treatment. OS: Overall survival.
- Citation: Digklia A, Voutsadakis IA. Eribulin for heavily pre-treated metastatic breast cancer patients. World J Exp Med 2015; 5(3): 194-199
- URL: https://www.wjgnet.com/2220-315X/full/v5/i3/194.htm
- DOI: https://dx.doi.org/10.5493/wjem.v5.i3.194


