
















Copyright: ©Author(s) 2026.
World J Exp Med. Jun 20, 2026; 16(2): 118250
Published online Jun 20, 2026. doi: 10.5493/wjem.v16.i2.118250
Published online Jun 20, 2026. doi: 10.5493/wjem.v16.i2.118250
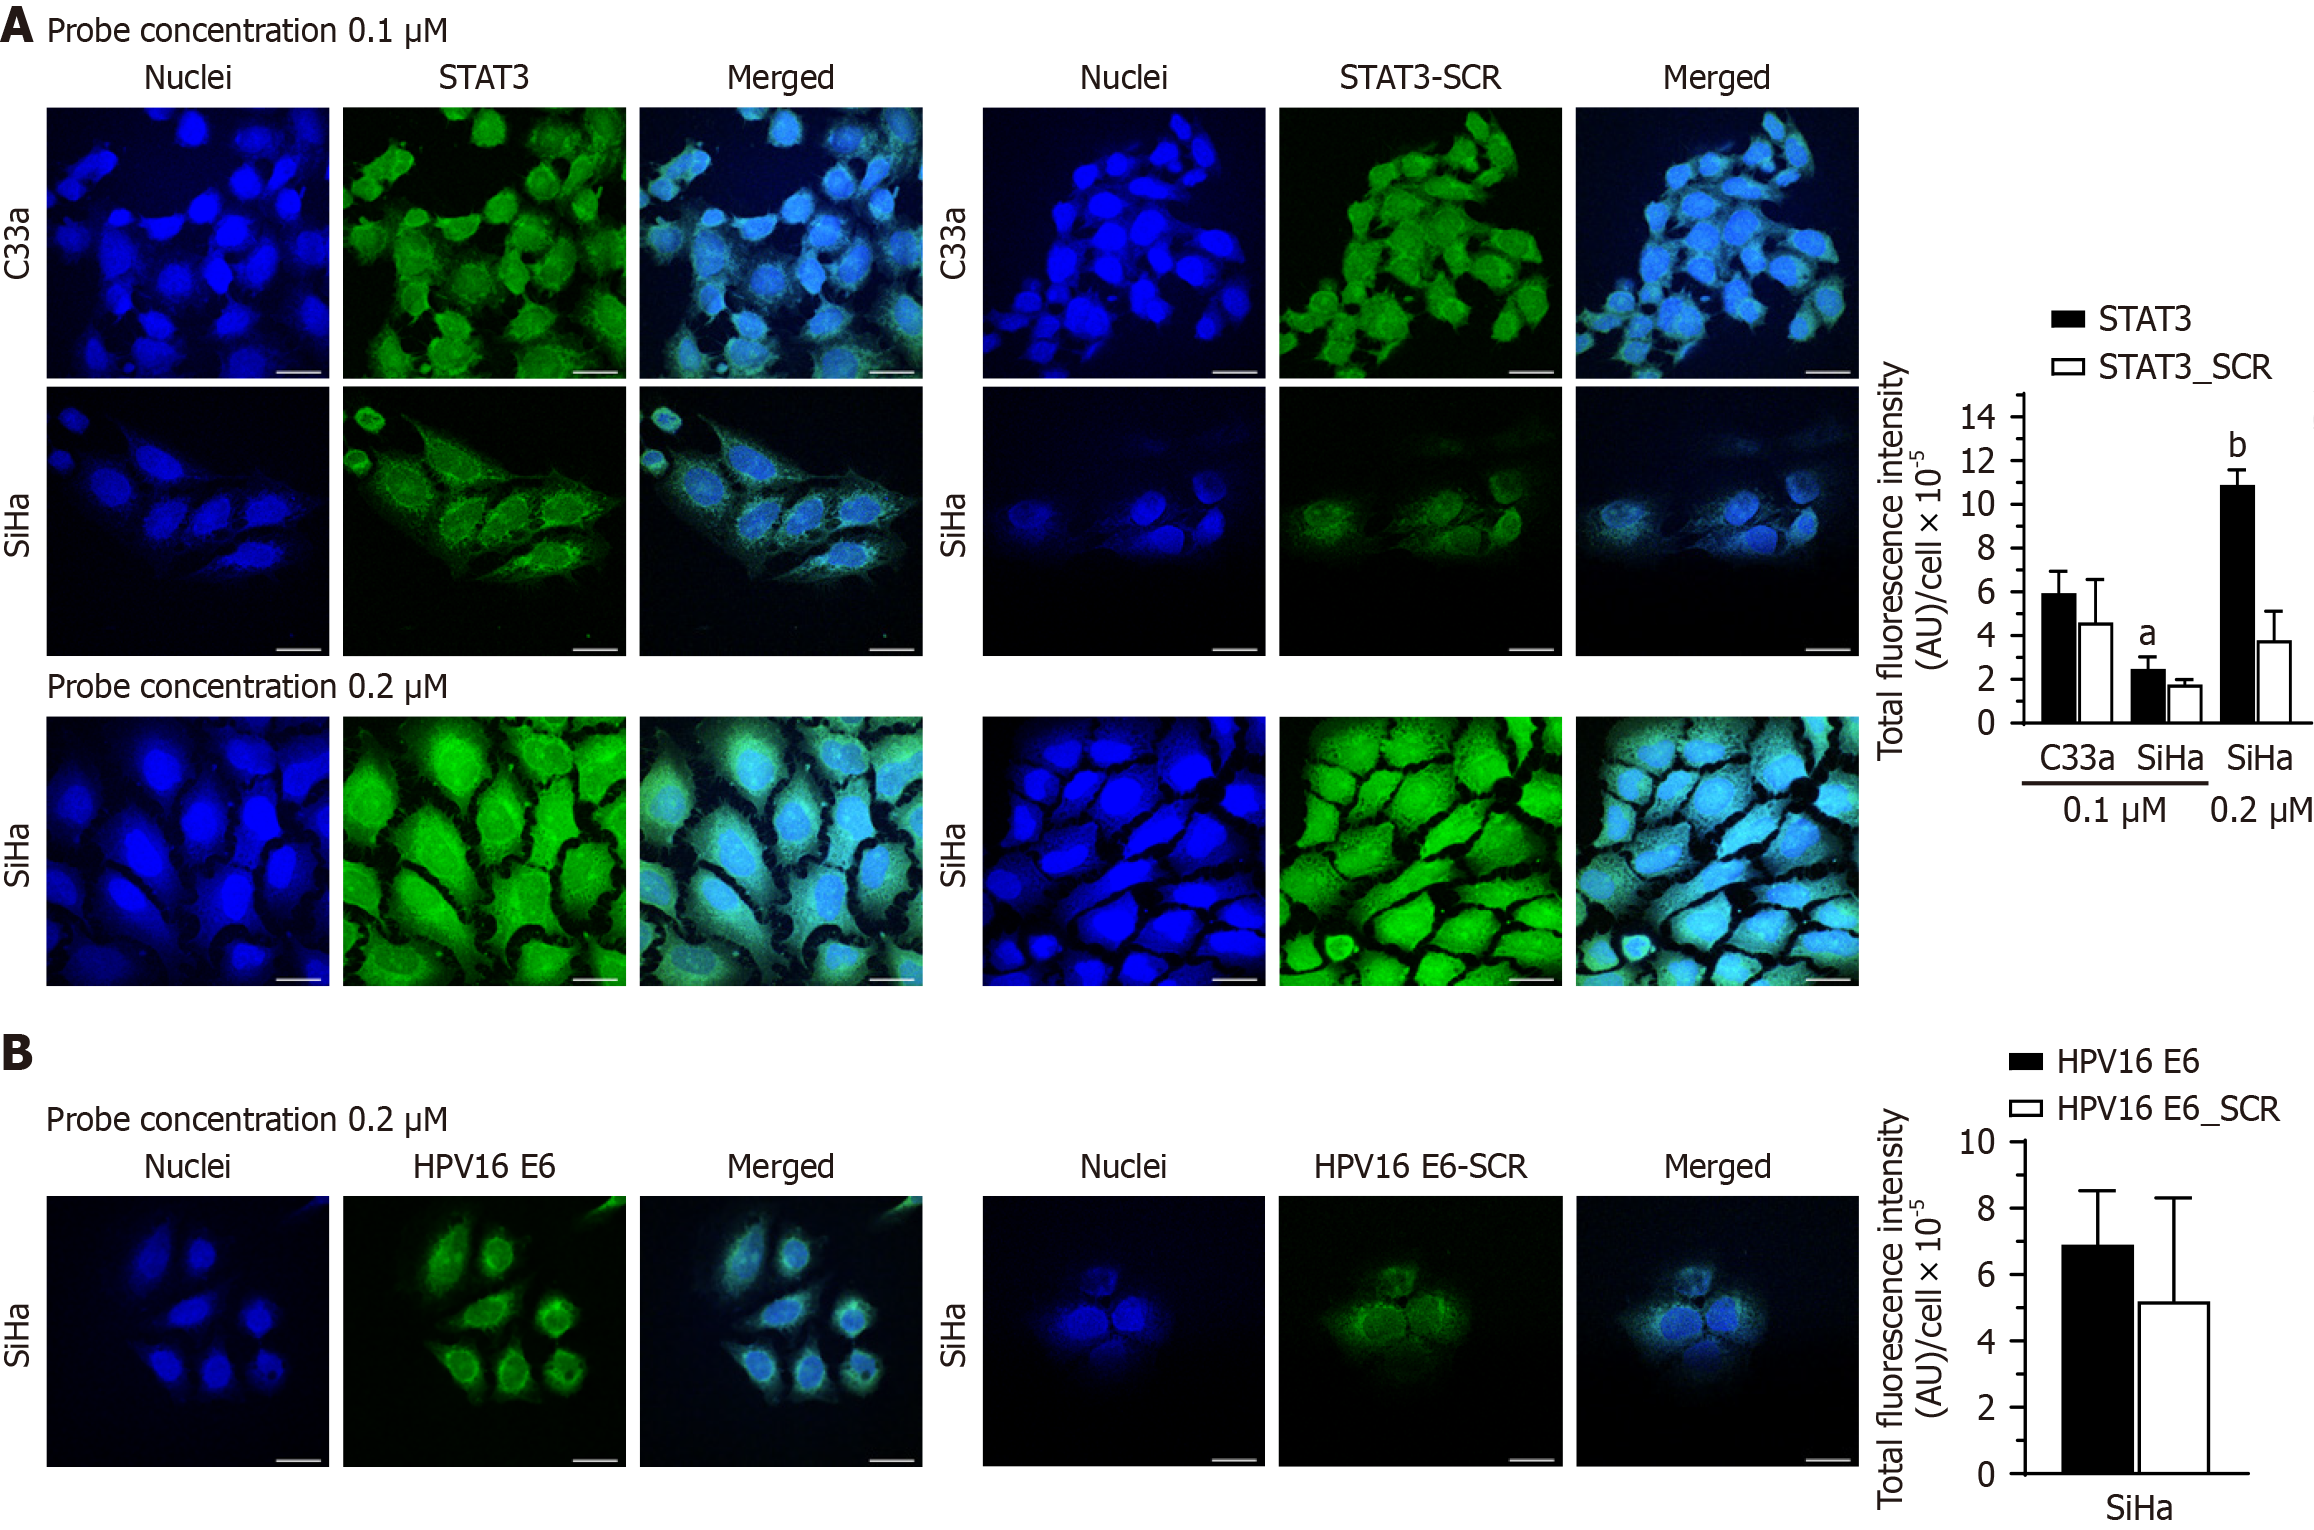
Figure 3 Estimation of specificity of signal transducer and activator of transcription 3 and human papillomavirus 16 E6 at different probe concentrations.
aP < 0.05 vs C33a scrambled, bP < 0.0001 vs SiHa scrambled. A: Representative fluorescence photomicrographs showing expression of signal transducer and activator of transcription 3 (STAT3) transcripts in C33a and SiHa at different concentrations of the probe. The upper panel represent the signal intensity at 0.1 μmol/L probe concentration and lower panel represent the signal intensity at 0.2 μmol/L probe concentration. Non-specific scrambled probe was used as a negative control to estimate the label of non-specific binding of the probe (scale bar: 20 μm). Bar graph showing fluorescence intensity of STAT3 probes and STAT3 scrambled probes; B: Representative fluorescence photomicrographs showing expression of human papillomavirus (HPV) 16 E6E7 transcripts in SiHa (scale bar: 20 μm). HPV16E6 scrambled probe was used as a negative control to estimate the specificity of the probe. Bar graph showing fluorescence intensity of HPV16 E6 probes and HPV16 E6 scrambled probes in SiHa. HPV: Human papillomavirus; STAT3: Signal transducer and activator of transcription 3; SCR: Single locus scrambled probes.
- Citation: Chhokar A, Joshi U, Tripathi T, Gupta B, Mudassir M, Janjua D, Chaudhary A, Yadav J, Aggarwal N, Jaggi VK, Bharti AC. Quantitative assessment of STAT3 and HPV16 E6 transcripts using Flow-FISH approach for early detection of progressive cervical lesions. World J Exp Med 2026; 16(2): 118250
- URL: https://www.wjgnet.com/2220-315X/full/v16/i2/118250.htm
- DOI: https://dx.doi.org/10.5493/wjem.v16.i2.118250