
















Copyright: ©Author(s) 2026.
World J Exp Med. Jun 20, 2026; 16(2): 118250
Published online Jun 20, 2026. doi: 10.5493/wjem.v16.i2.118250
Published online Jun 20, 2026. doi: 10.5493/wjem.v16.i2.118250
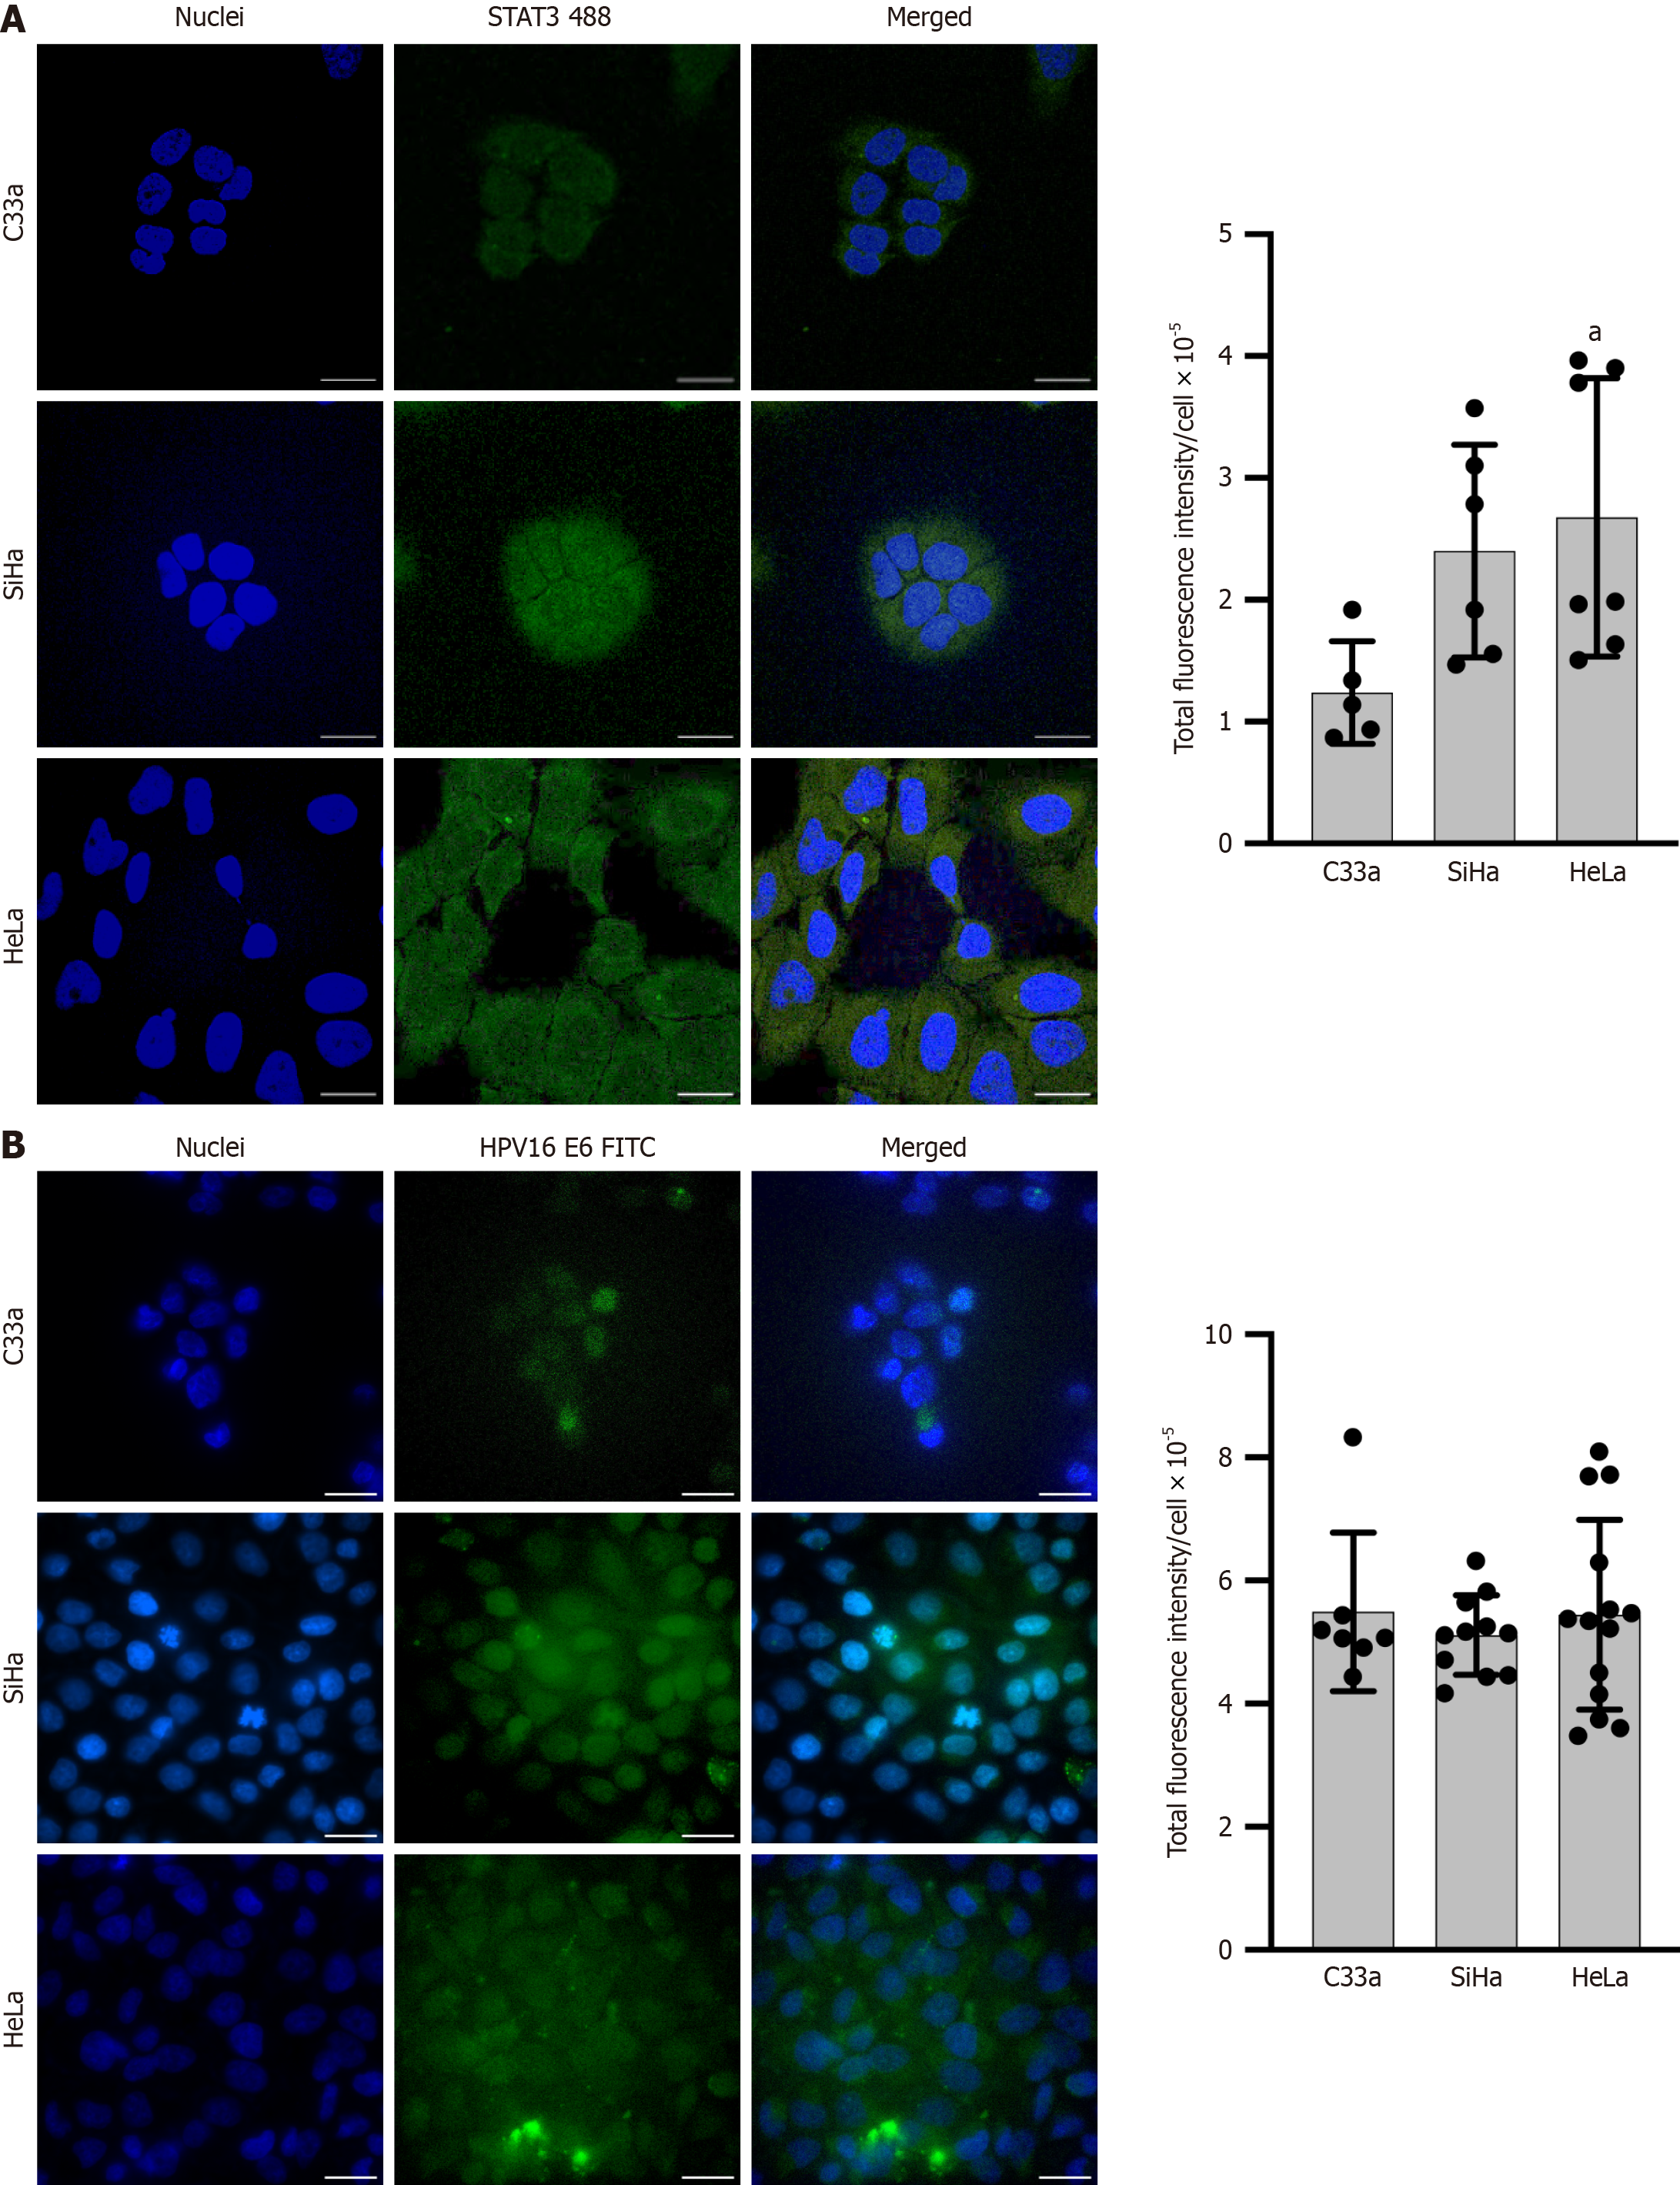
Figure 2 Evaluation and quantitation of signal transducer and activator of transcription 3 and human papillomavirus 16 E6 transcripts in CaCx cell lines using fluorescence microscopy.
Data are presented as mean ± SD. aP < 0.05 vs C33a. A: Representative fluorescence photomicrographs showing fluorescence intensity of signal transducer and activator of transcription 3 (STAT3); B: Representative fluorescence photomicrographs showing fluorescence intensity of human papillomavirus (HPV) 16 E6. CaCx cells were grown on cover glass, fixed with BD Permfix and stained with STAT3 probes labelled with Alexa Fluor 488 and biotin-linked HPV16 probes visualized with streptavidin-fluorescein isothiocyanate. Cells were counterstained with 4’,6-diamidino-2-phenylindole (blue) and examined at magnification 1000 ×. Bar graphs represent the mean fluorescence intensity of STAT3 and HPV16 E6 stained cells. HPV: Human papillomavirus; STAT3: Signal transducer and activator of transcription 3.
- Citation: Chhokar A, Joshi U, Tripathi T, Gupta B, Mudassir M, Janjua D, Chaudhary A, Yadav J, Aggarwal N, Jaggi VK, Bharti AC. Quantitative assessment of STAT3 and HPV16 E6 transcripts using Flow-FISH approach for early detection of progressive cervical lesions. World J Exp Med 2026; 16(2): 118250
- URL: https://www.wjgnet.com/2220-315X/full/v16/i2/118250.htm
- DOI: https://dx.doi.org/10.5493/wjem.v16.i2.118250