Published online Nov 20, 2013. doi: 10.5321/wjs.v2.i4.91
Revised: September 19, 2013
Accepted: October 17, 2013
Published online: November 20, 2013
Processing time: 253 Days and 23.2 Hours
AIM: To determine the accuracy of tomography in the linear measurement of alveolar bone at maxillary sinus/nose location.
METHODS: Two dry skulls each marked with 10 pairs of guttaperchas placed on buccal and lingual sides of the maxillary ridge were used in this in vitro study. The distance between the alveolar crest and the sinus/nasal floor was measured on tomographic views, prepared by linear and spiral techniques. The ridges were then sectioned so that each section would include one pair of buccal and lingual guttaperchas. The actual distances directly measured on the sections were compared to those of the equivalent tomographic sections (the magnification co-efficient was applied). Paired t-test was used to statistically analyze the data.
RESULTS: The measurement error with the application of linear tomography and spiral tomography was shown to be 0.455 ± 0.838 mm (P = 0.029) and 0.17 ± 0.78 mm (P = 0.347), respectively. There was a statistically significant difference between the liner tomography values and actual values (P = 0.029). This difference was representative of underestimation. McNamara’s test was used to assess the ± 1 mm error; 73.7% of the linear values and 84.2% of the spiral values were within the ± 1 mm error limit. McNamara’s test did not show any significant differences between the 2 methods in this regard (P = 0.625). The linear values were significantly different to the actual values (P = 0.029) but not to the spiral values (P = 0.185).
CONCLUSION: Spiral tomography has enough accuracy for the measurement of alveolar ridge height. Although linear tomography somewhat underestimates the actual values it provides satisfactory accuracy.
Core tip: Maxillary partial or complete edentulism represent some challenging conditions in implant dentistry. The position of sinus/nasal floor in partial/complete edentulous maxilla determines the alveolar bone height and consequently the length of the implants that can be used. Although cone beam cone beam computed tomography and conventional computed tomography are widely used for pre-operative implant treatment planning, they are expensive and can expose patients to relatively high dose of radiation. We demonstrated that tomography can be a good substitute for conventional and cone beam computed tomography for alveolar length measurement at maxilla, although spiral tomography is more accurate than linear tomography.
-
Citation: Yoozbashizadeh M, Fatemitabar SA, Sedighara E, Nikgoo A. Accuracy of linear
vs spiral tomography: Alveolar crest to sinus/nasal floor height. World J Stomatol 2013; 2(4): 91-96 - URL: https://www.wjgnet.com/2218-6263/full/v2/i4/91.htm
- DOI: https://dx.doi.org/10.5321/wjs.v2.i4.91
Although computed tomography (CT) and cone beam computed tomography (CBCT) are frequently used for pre-operative implant planning, their use in the post-operative assessments is limited due to metallic streak artifacts[1,2]. Also CBCT is associated with artifacts such as truncated view and beam hardening artifacts[3,4]. Another disadvantage of computed tomography is its relatively high radiation risk compared to conventional tomography[5-7].
The position of the maxillary sinus floor influences the height of the alveolar bone and consequently the implant length to be placed. Tomographic views are considered as the most reliable projections in the assessment of potential implant sites prior to surgery since they provide the clinician with the buccolingual information of the anatomic structures[1,5].
The measurement accuracy of most recent tomographic techniques in the assessment of mandibular landmarks has been thoroughly discussed through the literature[8-14]. A recent systematic review has concluded that each landmark possesses a unique error pattern and contributes independently to the measurement inaccuracy[15]. Since the alveolar crest height meaning the distance between the maxillary sinus floor and the alveolar crest serves as an important factor in the placement of dental implants., The present study aimed to compare the measurement accuracy of two tomography techniques, linear and spiral, in the maxilla of dry human skull.
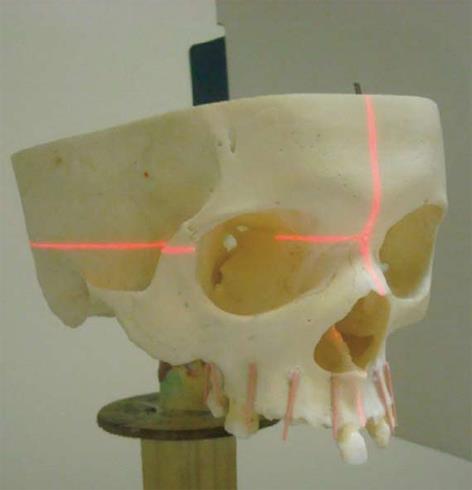
In this in vitro study, two dry skulls with intact maxillary sinus, nasal floor and foramen magnum, one completely and the other partially edentulous, were used. Each skull was then marked in 10 regions posteroanteriorly. Panoramic scout views were prepared to measure the alveolar ridge height. Each skull was then marked in five regions on each side with 70 guttapercha using glue every 1 cm and perpendicular to the ridge. The most distal guttapercha was placed in the third molar region and the most anterior one was placed in the lateral incisor region. A total of 20 areas (4 × 5) were marked (Figure 1). Each area was marked with two guttaperchas one on the lingual and the other on the buccal aspects of the alveolar ridge.
To prepare tomographic views, skulls were fixed on a wooden jig. Tomographic views were obtained twice, first using multitask Cranex TOME device (Orion Corporation Sordex, Helsinki, Finland) and then using Planmeca Promax (Helsinki, Finland). Kodak X-Omat cassette (Ektavision) and Agfa Single Emulsion (CP-VB) (15 cm × 30 cm) film were used. For spiral tomography, the dental tomo program for the upper jaw was selected at 57 kV, 2.5 mA and 56 s. Slice thickness was set to be 2 mm and the aperture number was 4. For linear tomography, the minimum adjustments, 54 kV and 0.5 mA, were set. Slice thickness was set to be 3 mm (Table 1). In all cases skulls were placed so that the maxillary occlusal plane would be parallel to the horizon. A total number of 20 cross-sections were prepared on each X-ray unit.
| Machine type | Promax | Cranex Tome |
| Manufactorer | Planmeca, Helsinki, Finland | Sordex, Helsinki, Finland |
| Tube voltage (kV) | 54 | 57 |
| Tube current (mA) | 0.5 | 2.5 |
| Slice thickness (mm) | 3 | 2 |
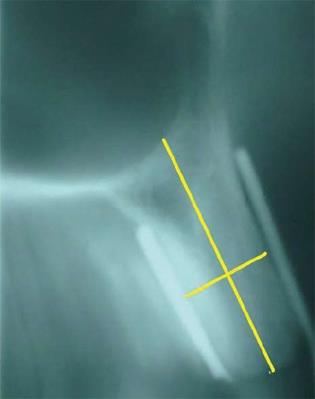
The films were processed in an automatic processing machine (OPTIMAX 2010; PROTEK Medizintechnik, oberstenfeld, Germany). Measurements were done on a negatoscope in a semi-dark room using a digital sliding caliper. The view with the clearest gutta-percha was selected for measurement on each radiograph. The alveolar crest and the maxillary/nasal floor were then outlined on tracing papers which were superimposed on the radiographic views. Bone height was measured in an oblique direction along the medial axis of the alveolar process, similar to the direction of implant placement[5]. The distance between the sinus floor to the alveolar ridge traced on this line was considered as the ridge height (Figure 2). Measurements were done twice by an oral radiologist and an oral radiology senior resident each with a time interval of 2 wk.
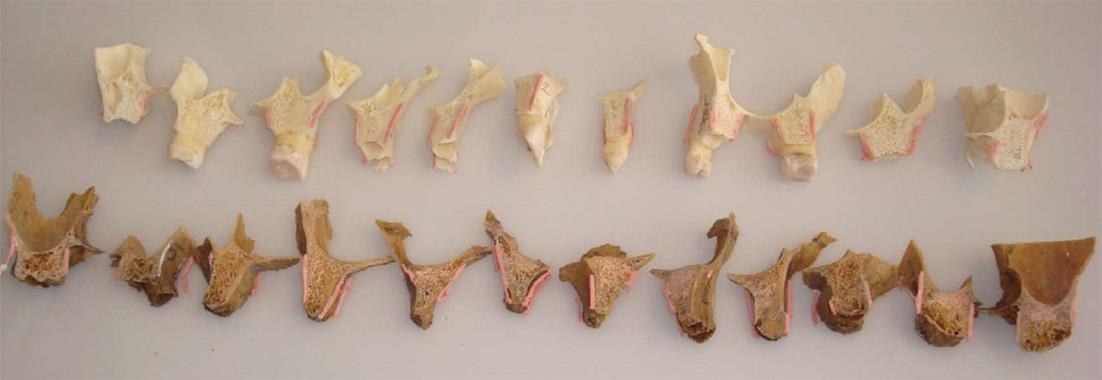
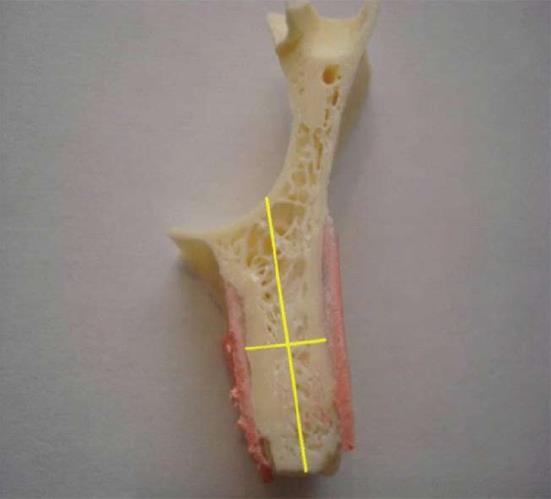
The whole alveolar process was cut with electric saw first and then hand jig saw was used to separate the marked sections (Figure 3). Bone height on the sections was measured similar to the films sing a digital sliding caliper with a nominal resolution of 0.01 mm (Figure 4). To determine the magnification factor, a pilot study was designed and performed through which the actual length of the guttaperchas and their length on the radiographic view was measured. The magnification was calculated dividing the mean radiographic values to the actual values. The magnification factors were similar to the ones defined by the manufacturer (1.5 for both devices). The actual values measured on the bone sections were considered as the gold standard.
Data were inserted in SPSS v. 15, and then were analyzed by Paired t-test and McNemar’s test. Linear regression model was used to assess the relation between the actual values and tomogram values. Mean values and standard deviations were used to describe quantitative values and percent. Proportions and bar charts were used to describe qualitative data. A 0.05 level of significance was considered.
Twenty specimens were primarily used in the present study, from which one specimen was excluded due to the displacement of guttapercha. The extent of maxillary sinus floor and nasal floor was recognizable on all tomographic views. Measurements were, however, more challenging in the posterior areas and also in dentate skull. Paired t-test was used to compare the measurement differences between the linear and spiral tomography to the actual values multiplied by the magnification co-efficient. The mean error for linear and spiral tomographic views were 0.455 ± 0.838 mm (P = 0.029) and 0.174 ± 0.787 mm (P = 0.347), respectively. There was a statistically significant difference between the linear tomography values and actual values (P = 0.029). This difference was representative of underestimation. Non-parametric Wilcoxon signed rank test (a non-parametric equivalent to paired t-test) also revealed a statistically significant difference for linear tomography (P = 0.035) and a statistically not significant difference for spiral tomography (P = 0.587).
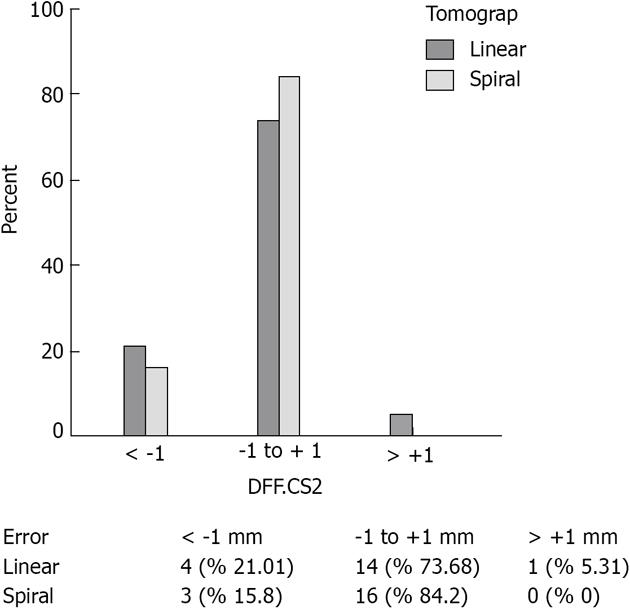
Paired t-test also showed a significantly higher deviation from the actual values in linear tomography compared to spiral tomography (P = 0.017). This was confirmed by Wilcoxon test (P = 0.026). However, neither t-test (P = 0.185) nor Wilcoxon test (P = 0.199) revealed a significant difference between the linear and spiral values after they were multiplied by the magnification factor. McNemar’s test was used to assess the ± 1 mm error. Error values in linear and spiral tomographies were within ± 1 mm respectively in 73.68% and 84.2% of the cases. McNemar’s test did not show any significant differences between the two methods in this regard (P = 0.625).
After the application of magnification factors to the values obtained by linear tomography, overestimation and underestimation were respectively seen in 21.01% and 78.99% of the cases. Overestimation and underestimation were respectively seen in 47.3% and 52.7% cases of spiral tomography. All the overestimation cases of spiral tomography were within the error limit of ± 1 mm. Mean spiral overestimation was within 0.02 to 0.91 mm. Mean linear overestimation was within 0.38 to 1.5 mm. Mean underestimation values of linear and spiral tomographies were respectively within the ranges of 0.04 to 1.8 mm and 0.03 to 1.4 mm (except for one case of spiral tomography which showed an underestimation of 2.19 mm). Figure 5 represent the distribution of errors within the ± 1 mm range.
Linear and spiral tomography techniques were compared in the present study in terms of accuracy in the pre-operative assessment of the maxillary bone height. To the best of our knowledge, the literature lacks enough studies on the localization of maxilla, maxillary sinus and nasal floor and most studies have addressed the localization of mandibular canal.
It is generally accepted that more complex tomographic movements are associated with higher blurring of the background images and less streaking artifacts[1]. Spiral and hypocycloidal movements will reduce the incidence of streaking artifacts[16,17]. In the studies of Lindh et al[18] spiral tomography provided more accurate views of the mandibular canal compared to hypocycloidal tomography. In the present study, the actual values measured directly on the skull sections and the values obtained from linear tomograms were significantly different (P = 0.029). The mean difference was measured 0.455 ± 0.83 mm for linear tomography and 0.174 ± 0.78 mm in spiral tomography. This difference was not significant for spiral tomography (P = 0.347). The significant difference in linear tomography may be partly due to the quality of images. In spiral tomography the quality of images especially in the anterior area was better and the outlines could be more easily detected. Due to the insufficient number of specimens, however, this comparison between the anterior and the posterior areas was not statistically implacable.
Naitoh et al[19] compared the measurement accuracy of direct laser positioning and reformatted CT. They suggested that other factors including tomographic angle and the placement angle of the object to be projected also influence the measurement accuracy in addition to the motion pattern. They did not find any significant differences between the two methods in mandible measurements (P = 0.526). They believed the significant lower accuracy of the linear tomography found through other studies is due to the difficulties in the adjustment of the projection plan of the object and not due to the image quality.
The main purpose of the present study was to compare two types of tomography in terms of linear measurements rather than image quality. Statistical analysis failed to reveal any significant differences between the two methods in the measurement of the distance between the alveolar crest and the sinus/nasal floor (P = 0.185). Spiral tomography values obtained through the present study are consistent to the findings of Bou Serhal et al[5] who assessed the measurement accuracy of the spiral tomography in upper jaw. They reported a mean error of 0.24 ± 0.19 mm which was not significantly different to the actual values (P > 0.05). They stated some quality impairment in the images obtained from the most distal slices and though it was attributed to the placement of more bony structures in the area. Similarly, Kim et al[20] experienced quality impairment in mandibular posterior areas projected by Scanora spiral tomography. Higher image quality in the study of Bou Serhal et al[5] may be attributed to the complete edentulousness of the studied skulls, which may have eliminated the artifacts commonly created by the presence of restorations and natural teeth. Similarly, the quality of images obtained from the anterior areas was higher compared to those of posterior areas in the present study both with spiral and linear tomographies. Also spiral projections were associated with higher image quality in anterior areas compared to linear tomography.
Bou Serhal et al[21] also evaluated the accuracy of conventional spiral tomography [Cranex TOME multifunctional unit (Orion Corporation Sordex; Helsinki, Finland)] for the localization of the mandibular canal on human fresh cadavers and reported higher mean error values compared to their previous study. They concluded that the information provided by spiral tomography of the posterior mandible using the studied unit is reliable and sufficient for preoperative planning of implant placement. They attributed the different results of the two studies to the fact that the absence of overlying soft tissue provides the observer with a higher resolution of the bony mandible and also more precise adjustments of skull compared to the patient or cadaver in the latter study.
Butterfield et al[17] examined linear tomography in terms of accuracy and validity in the pre-surgical evaluation of potential implant sites in mandible. They claimed that linear tomography suffers from prominent dimensional instability, which significantly limits its role in preoperative assessment of implant sites. Seven observers traced eight anatomic landmarks including the mandibular cortical bone and inferior alveolar canal on linear tomographic images. Statistically significant differences were found between the perceived and actual anatomic values (P < 0.05). They suggested that since the source to image receptor distance, source to object distance and object to image receptor distance change with a constant proportion to each other during the tomographic movements, linear tomography does not hold a constant magnification factor. Consistently, linear tomography in the present study was associated with a significant underestimation of the measurement values of alveolar crest height (P = 0.029). On the other hand, the pilot linear tomography of guttaperchas conducted by the author of the present study revealed a magnification factor (1.498) which closely approximated the manufacturers (1.5).
Bou Serhal et al[21] measured an actual magnification factor of 1.49 for the Cranex TOME spiral tomography unit both in vertical and horizontal planes. Closely similar, the magnification factor measured in the present study for the same device was equal to 1.518.
In the present study, spiral tomograms showed underestimation and overestimation respectively in 52.7% and 47.3% of the cases. The overestimation in the present study was higher than that of Bou Serhal study in 2000 (33.3%). Also the linear tomograms of our study presented with underestimation and overestimation in 78.99% and 21.01% of the cases, respectively. Based on these findings, it may be suggested that overestimation occurs more frequently in spiral tomography and underestimation occurs more frequently in linear tomography. Underestimation would seemingly be preferable in the implant placement especially when the mandibular body above the mandibular canal is considered as a potential implantation site[18]. Loubele et al[3] comparatively assessed the measurement accuracy of multi-slice spiral CT, spiral tomography and cone-beam tomography. They measured an overestimation of 1 mm for the spiral tomography. CBCT in their study (except for one case) was only associated with approximate overestimation of 0.5 mm. In the present study, spiral tomography was associated with an overestimation of less than 1 mm (maximum of 0.91 mm). This value was measured to be maximally 1.5 mm with the application of linear tomography especially in the anterior areas of dentate skulls. However, since the significant difference tended towards underestimation with the application of linear tomography in the present study, and also due to the higher safety of underestimation compared to overestimation, the measurement accuracy of the linear tomography seems to be within the satisfactory clinical range. On the other hand, underestimation may result in the application of a shorterimplant, which may impair the long term prognosis survival of the implant and success of the overlying prosthetic restoration[18].
Spiral tomography in the study of Bou Serhal et al[5] was associated with a accuracy of ± 1 mm in the measurement of alveolar crest to maxillary sinus distance. Klinge et al[22] measured the distance between the alveolar crest to the inferior border of the mandibular canal by means of hypocycloidal tomography and reported that only 39% of the cases were associated with a accuracy of within ± 1 mm. Hanazawa et al[23] measured the same distance by spiral tomography and reported that 47.9% of the cases are within the ± 1 mm accuracy. In the present study, spiral tomography and linear tomography were associated with ± 1 mm accuracy respectively in 84.2% and 73.68% of the cases after the magnification factors were applied.
McNemar’s test did not reveal any significant differences between the two tomographies in terms of the percent of the cases within the ± 1 mm accuracy (P = 0.625). Clinically the value of underestimation and overestimation is more important than the absolute difference of the perceived and actual values[21].
The values measured on the linear tomograms obtained by Promax unit significantly differ to actual values (P < 0.029). This difference tends toward underestimation. There is, however, a significant correlation between the linear and spiral tomographies. Therefore it seems that both linear (Promax) and spiral (Cranex Tome) tomography are associated with sufficiently accuracy in the pre-surgical assessment of potential implant sites in dry skull. Also the magnification factor introduced by the manufacturer is seemingly reliable for both devices. Linear and spiral tomography did not show any significant differences in the present study. This may not be the case in clinical situation where the soft tissue and dentition are present. Therefore, studies on human cadaver or in vivo trials are highly recommended to further assess the reliability of the two methods.
Maxillary Partial or complete edentulism is a common condition in dentistry and insufficient bone can be a challenge for a clinician who wants to place implants at edentulous Maxilla. The loss of maxillary teeth result in decrease in bone height (and width). The position of the maxillary sinus floor/nasal floor influences the height of the available alveolar bone and consequently the implant length to be placed. Different imaging modalities are used for detemining the hight of available bone at maxillary sinus area.
The imaging modality should be chosen that yields the necessary diagnostic information and results in less radiologic risk. Periapical radiography is of limited value in determining bone quantity due to its magnification, distortion, lack of third dimension and size limitation. Nowadays computed tomography and cone beam computed tomography are frequently used for pre-operative implant planning. Although they can provide us with invaluable information (3D images with high accuracy), they have their own disadvantages such as exposing the patient to the relatively high radiation, beam hardening artifacts and high costs. The hot spot is how to employ a modality which produces 3D images but wouldn’t expose patients to a high radiation dose. The answer can be tomography.
To the best knowledge of the authors of this article, the literature lacks enough studies on the localization of maxillary sinus and nasal floor and most studies have addressed the localization of mandibular canal. Linear and spiral tomography techniques were compared in the present study in terms of accuracy in the pre-operative assessment of the maxillary bone height. In this study, the actual values measured directly on the skull sections and the values obtained from linear tomograms were significantly different. This difference was not significant for spiral tomography. The significant difference in linear tomography may be partly due to the quality of images. In spiral tomography the quality of images especially in the anterior area was better and the outlines could be more easily detected. Due to the insufficient number of specimens, however, this comparison between the anterior and the posterior areas was not statistically implacable.
The study result suggests that spiral tomography has enough accuracy for the measurement of alveolar ridge height. Although linear tomography underestimates the actual values, it seems to provide satisfactory accuracy.
Tomography is generic term for describing sectional radiography. X-ray source and film move in opposite direction during exposure in this technique. Consequently, structures in the section of interest are sharp while the above and blow sections appears blurred.
This is an interesting study in which authors tested the accuracy of the measurements of linear and spiral tomography in maxilla. The results were intriguing and demonstrated that spiral tomography is an accurate imaging modality for pre-operative treatment plan. Although, linear tomography is not perceived as accurate as spiral tomography, it appears to be accurate enough to be utilized for a pre-surgical treatment plan.
P- Reviewer: da Silva Figueredo C S- Editor: Gou SX L- Editor: A E- Editor: Liu XM
| 1. | Tyndall DA, Brooks SL. Selection criteria for dental implant site imaging: a position paper of the American Academy of Oral and Maxillofacial radiology. Oral Surg Oral Med Oral Pathol Oral Radiol Endod. 2000;89:630-637. [RCA] [PubMed] [DOI] [Full Text] [Cited by in Crossref: 176] [Cited by in RCA: 142] [Article Influence: 5.7] [Reference Citation Analysis (0)] |
| 2. | Ismail YH, Azarbal M, Kapa SF. Conventional linear tomography: protocol for assessing endosseous implant sites. J Prosthet Dent. 1995;73:153-157. [RCA] [PubMed] [DOI] [Full Text] [Cited by in Crossref: 8] [Cited by in RCA: 9] [Article Influence: 0.3] [Reference Citation Analysis (0)] |
| 3. | Loubele M, Guerrero ME, Jacobs R, Suetens P, van Steenberghe D. A comparison of jaw dimensional and quality assessments of bone characteristics with cone-beam CT, spiral tomography, and multi-slice spiral CT. Int J Oral Maxillofac Implants. 2007;22:446-454. [PubMed] |
| 4. | Mozzo P, Procacci C, Tacconi A, Martini PT, Andreis IA. A new volumetric CT machine for dental imaging based on the cone-beam technique: preliminary results. Eur Radiol. 1998;8:1558-1564. [RCA] [PubMed] [DOI] [Full Text] [Cited by in Crossref: 785] [Cited by in RCA: 751] [Article Influence: 27.8] [Reference Citation Analysis (0)] |
| 5. | Bou Serhal C, Jacobs R, Persoons M, Hermans R, van Steenberghe D. The accuracy of spiral tomography to assess bone quantity for the preoperative planning of implants in the posterior maxilla. Clin Oral Implants Res. 2000;11:242-247. [RCA] [PubMed] [DOI] [Full Text] [Cited by in Crossref: 24] [Cited by in RCA: 26] [Article Influence: 1.0] [Reference Citation Analysis (0)] |
| 6. | Ekestubbe A, Thilander A, Gröndahl K, Gröndahl HG. Absorbed doses from computed tomography for dental implant surgery: comparison with conventional tomography. Dentomaxillofac Radiol. 1993;22:13-17. [PubMed] |
| 7. | Chau AC, Fung K. Comparison of radiation dose for implant imaging using conventional spiral tomography, computed tomography, and cone-beam computed tomography. Oral Surg Oral Med Oral Pathol Oral Radiol Endod. 2009;107:559-565. [PubMed] |
| 8. | Kamburoğlu K, Kiliç C, Ozen T, Yüksel SP. Measurements of mandibular canal region obtained by cone-beam computed tomography: a cadaveric study. Oral Surg Oral Med Oral Pathol Oral Radiol Endod. 2009;107:e34-e42. [RCA] [PubMed] [DOI] [Full Text] [Cited by in Crossref: 71] [Cited by in RCA: 63] [Article Influence: 3.9] [Reference Citation Analysis (0)] |
| 9. | Brown AA, Scarfe WC, Scheetz JP, Silveira AM, Farman AG. Linear accuracy of cone beam CT derived 3D images. Angle Orthod. 2009;79:150-157. [RCA] [PubMed] [DOI] [Full Text] [Cited by in Crossref: 117] [Cited by in RCA: 123] [Article Influence: 7.7] [Reference Citation Analysis (0)] |
| 10. | Ballrick JW, Palomo JM, Ruch E, Amberman BD, Hans MG. Image distortion and spatial resolution of a commercially available cone-beam computed tomography machine. Am J Orthod Dentofacial Orthop. 2008;134:573-582. [RCA] [PubMed] [DOI] [Full Text] [Cited by in Crossref: 118] [Cited by in RCA: 116] [Article Influence: 6.8] [Reference Citation Analysis (0)] |
| 11. | Moerenhout BA, Gelaude F, Swennen GR, Casselman JW, Van Der Sloten J, Mommaerts MY. Accuracy and repeatability of cone-beam computed tomography (CBCT) measurements used in the determination of facial indices in the laboratory setup. J Craniomaxillofac Surg. 2009;37:18-23. [RCA] [PubMed] [DOI] [Full Text] [Cited by in Crossref: 44] [Cited by in RCA: 46] [Article Influence: 2.7] [Reference Citation Analysis (0)] |
| 12. | Periago DR, Scarfe WC, Moshiri M, Scheetz JP, Silveira AM, Farman AG. Linear accuracy and reliability of cone beam CT derived 3-dimensional images constructed using an orthodontic volumetric rendering program. Angle Orthod. 2008;78:387-395. [RCA] [PubMed] [DOI] [Full Text] [Cited by in Crossref: 197] [Cited by in RCA: 207] [Article Influence: 12.2] [Reference Citation Analysis (0)] |
| 13. | Veyre-Goulet S, Fortin T, Thierry A. Accuracy of linear measurement provided by cone beam computed tomography to assess bone quantity in the posterior maxilla: a human cadaver study. Clin Implant Dent Relat Res. 2008;10:226-230. [PubMed] |
| 14. | Stratemann SA, Huang JC, Maki K, Miller AJ, Hatcher DC. Comparison of cone beam computed tomography imaging with physical measures. Dentomaxillofac Radiol. 2008;37:80-93. [RCA] [PubMed] [DOI] [Full Text] [Cited by in Crossref: 150] [Cited by in RCA: 156] [Article Influence: 9.2] [Reference Citation Analysis (0)] |
| 15. | Lou L, Lagravere MO, Compton S, Major PW, Flores-Mir C. Accuracy of measurements and reliability of landmark identification with computed tomography (CT) techniques in the maxillofacial area: a systematic review. Oral Surg Oral Med Oral Pathol Oral Radiol Endod. 2007;104:402-411. [PubMed] |
| 16. | Stella JP, Tharanon W. A precise radiographic method to determine the location of the inferior alveolar canal in the posterior edentulous mandible: implications for dental implants. Part 2: Clinical application. Int J Oral Maxillofac Implants. 1990;5:23-29. [PubMed] |
| 17. | Butterfield KJ, Dagenais M, Clokie C. Linear tomography’s clinical accuracy and validity for presurgical dental implant analysis. Oral Surg Oral Med Oral Pathol Oral Radiol Endod. 1997;84:203-209. [RCA] [PubMed] [DOI] [Full Text] [Cited by in Crossref: 19] [Cited by in RCA: 20] [Article Influence: 0.7] [Reference Citation Analysis (0)] |
| 18. | Lindh C, Petersson A, Klinge B. Measurements of distances related to the mandibular canal in radiographs. Clin Oral Implants Res. 1995;6:96-103. [RCA] [PubMed] [DOI] [Full Text] [Cited by in Crossref: 71] [Cited by in RCA: 76] [Article Influence: 2.5] [Reference Citation Analysis (0)] |
| 19. | Naitoh M, Kawamata A, Iida H, Ariji E. Cross-sectional imaging of the jaws for dental implant treatment: accuracy of linear tomography using a panoramic machine in comparison with reformatted computed tomography. Int J Oral Maxillofac Implants. 2002;17:107-112. [PubMed] |
| 20. | Kim KD, Park CS. Reliability of spiral tomography for implant site measurement of the mandible. J Korean Acad Oral Maxillofac Radiol. 1997;27:27-48. |
| 21. | Bou Serhal C, van Steenberghe D, Quirynen M, Jacobs R. Localisation of the mandibular canal using conventional spiral tomography: a human cadaver study. Clin Oral Implants Res. 2001;12:230-236. [RCA] [PubMed] [DOI] [Full Text] [Cited by in Crossref: 30] [Cited by in RCA: 26] [Article Influence: 1.1] [Reference Citation Analysis (0)] |
| 22. | Klinge B, Petersson A, Maly P. Location of the mandibular canal: comparison of macroscopic findings, conventional radiography, and computed tomography. Int J Oral Maxillofac Implants. 1989;4:327-332. [PubMed] |
| 23. | Hanazawa T, Sano T, Seki K, Okano T. Radiologic measurements of the mandible: a comparison between CT-reformatted and conventional tomographic images. Clin Oral Implants Res. 2004;15:226-232. [RCA] [PubMed] [DOI] [Full Text] [Cited by in Crossref: 35] [Cited by in RCA: 42] [Article Influence: 2.0] [Reference Citation Analysis (0)] |


