Copyright
©The Author(s) 2015.
World J Otorhinolaryngol. Aug 28, 2015; 5(3): 82-89
Published online Aug 28, 2015. doi: 10.5319/wjo.v5.i3.82
Published online Aug 28, 2015. doi: 10.5319/wjo.v5.i3.82
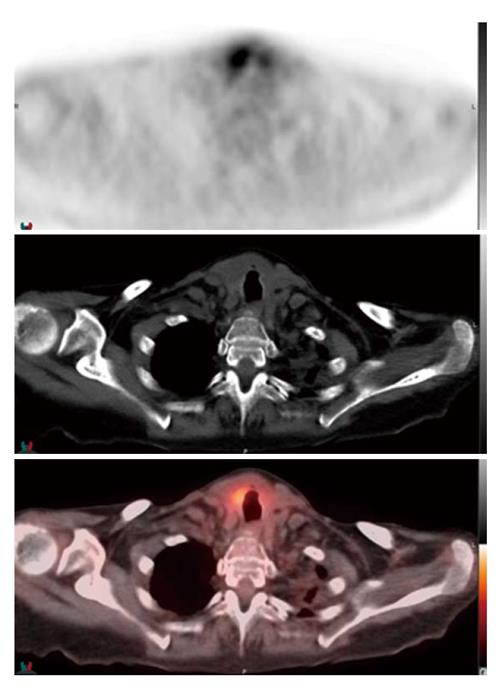
Figure 4 Axial positron emission tomography, computed tomography, and fusion images.
They performed 2 wk following initiation of therapy, demonstrating focal intense fluorodeoxyglucose uptake (SUVmax = 6.4) within an enlarged right hemi-thyroid demonstrating heterogeneous CT density, consistent with the biopsy-proven lymphomatous infiltration of the right hemi-thyroid. CT: Computed tomography; SUVmax: Standard uptake value maximum.
- Citation: Mehta K, Liu C, Raad RA, Mitnick R, Gu P, Myssiorek D. Thyroid lymphoma: A case report and literature review. World J Otorhinolaryngol 2015; 5(3): 82-89
- URL: https://www.wjgnet.com/2218-6247/full/v5/i3/82.htm
- DOI: https://dx.doi.org/10.5319/wjo.v5.i3.82


