Copyright
©The Author(s) 2016.
World J Ophthalmol. Aug 12, 2016; 6(3): 20-27
Published online Aug 12, 2016. doi: 10.5318/wjo.v6.i3.20
Published online Aug 12, 2016. doi: 10.5318/wjo.v6.i3.20
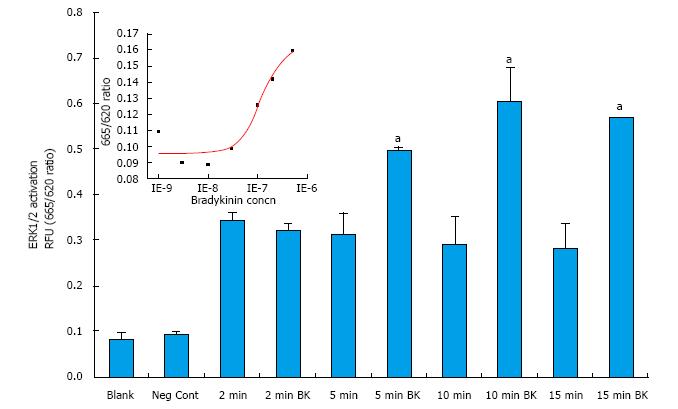
Figure 2 Time-course of bradykinin activation of extracellular signal-regulated kinase-1/2 in cultured primary human ciliary muscle cells.
Serum-deprived h-CM cells were incubated with either vehicle as control or with BK (100 nmol/L) for different time periods. At the end of incubation, cell lysates were analyzed for phosphorylated ERK1/2 as described in the Methods section. Data shown are blank (with nothing added), negative control (just vehicle added), followed by time control and with BK over 2-15 min. The BK-stimulated response was compared with its respective vehicle control at the same time of study. Statistical significances were determined by Student’s t-test with P < 0.05 being the minimally acceptable level of significance. Data are mean ± SEMs from 3 experiments. Differs from control at aP < 0.05 by Student’s t-test. The inset depicts a concentration-response curve for ERK1/2 activation by different concentrations of BK (1, 3, 10, 30, 100 nmol/L, etc.). ERK1/2: Extracellular signal-regulated kinase-1/2; h-CM: Human ciliary muscle; BK: Bradykinin.
- Citation: Sharif NA, Patil R, Li L, Husain S. Human ciliary muscle cell responses to kinins: Activation of ERK1/2 and pro-matrix metalloproteinases secretion. World J Ophthalmol 2016; 6(3): 20-27
- URL: https://www.wjgnet.com/2218-6239/full/v6/i3/20.htm
- DOI: https://dx.doi.org/10.5318/wjo.v6.i3.20


