Copyright
©The Author(s) 2016.
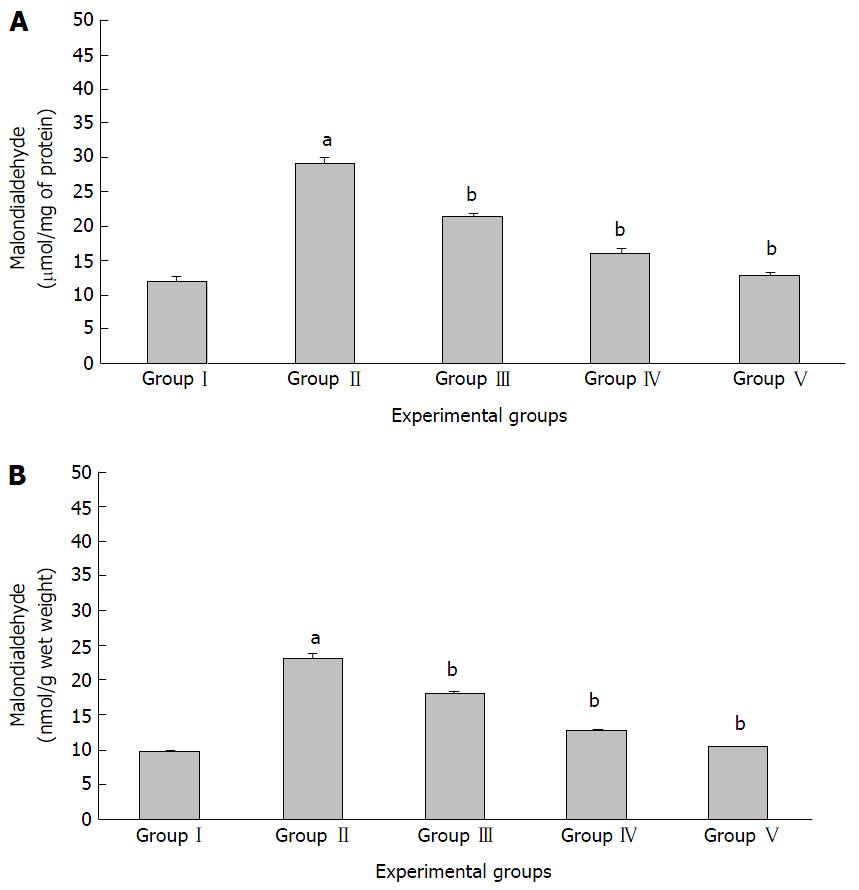
Figure 1 Quantitative analysis of malondialdehyde in the serum of Wistar albino rats (A) and in the eye lens of Wistar albino rats (B).
Each value represents the mean ± SD of observations made on samples from four determinations from the same group. Statistical analysis was performed by the student’s t-test. Letter “a” and “b” indicate that the difference observed between Group I and II and Group II and III-V animals were statistically significant at bP < 0.001 and aP < 0.05.
- Citation: Manikandan R, Arumugam M. Anticataractogenic effect of hesperidin in galactose-induced cataractogenesis in Wistar rats. World J Ophthalmol 2016; 6(1): 1-9
- URL: https://www.wjgnet.com/2218-6239/full/v6/i1/1.htm
- DOI: https://dx.doi.org/10.5318/wjo.v6.i1.1


