Copyright
©The Author(s) 2015.
World J Ophthalmol. May 12, 2015; 5(2): 86-98
Published online May 12, 2015. doi: 10.5318/wjo.v5.i2.86
Published online May 12, 2015. doi: 10.5318/wjo.v5.i2.86
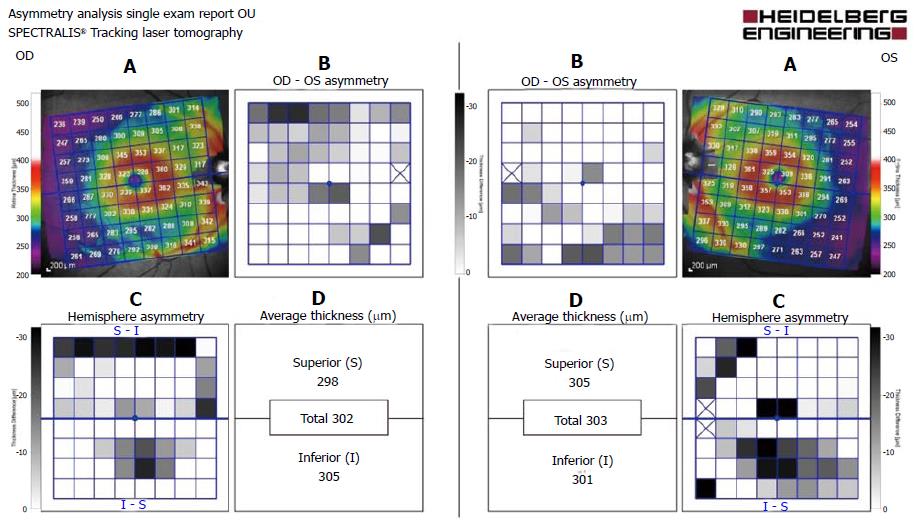
Figure 3 Spectralis.
A: Thickness map - the entire retinal thickness in the posterior pole displayed as a color coded thickness map for an 8 × 8 grid centered on the foveal pit positioned symmetrically to the fovea-disc axis; B: Asymmetry map - examination by grid of the asymmetry between the thicknesses in the corresponding cell of the fellow eye. Asymmetry color scale - darker grey indicates larger differences. The closer the value is to zero (white color), the better the symmetry; C: Hemisphere analysis - displays the asymmetry between the superior and the inferior hemisphere of each eye. The fovea-disc axis is the horizontal symmetry line. The lower half compares the inferior to the superior; D: Mean thickness - represents the mean retinal thickness for the superior and inferior hemisphere, as well as the total mean thickness over the entire 8 × 8 grid.
- Citation: Meshi A, Goldenberg D, Armarnik S, Segal O, Geffen N. Systematic review of macular ganglion cell complex analysis using spectral domain optical coherence tomography for glaucoma assessment. World J Ophthalmol 2015; 5(2): 86-98
- URL: https://www.wjgnet.com/2218-6239/full/v5/i2/86.htm
- DOI: https://dx.doi.org/10.5318/wjo.v5.i2.86


