Copyright
©The Author(s) 2015.
World J Ophthalmol. May 12, 2015; 5(2): 86-98
Published online May 12, 2015. doi: 10.5318/wjo.v5.i2.86
Published online May 12, 2015. doi: 10.5318/wjo.v5.i2.86
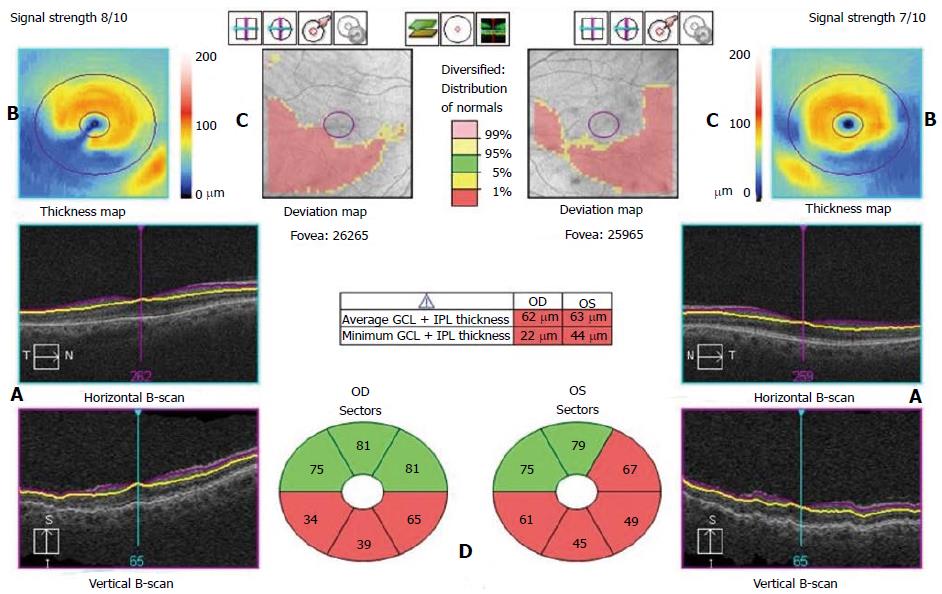
Figure 1 Cirrus HD-optical coherence tomography.
A: Segmentation. Horizontal and vertical B-scans. The purple line represents the inner boundary of the ganglion cell layer and the yellow line represents the outer boundary of the inner plexiform layer; B: Thickness map. Calculation of the ganglion cell layer (GCL) + inner plexiform layer (IPL) thickness data from an elliptical annulus, 6 mm × 6 mm grid, centered on the fovea; C: Deviation map. Comparison of the GCL + IPL thickness results to a normative database; D: Sectors. Ganglion cell analysis segmentation algorithm that divides the elliptical annulus of the thickness map into 6 equal sectors expressed in micrometers. Each spoke represents the average of the pixels along that spoke that lie within the measurement annulus.
- Citation: Meshi A, Goldenberg D, Armarnik S, Segal O, Geffen N. Systematic review of macular ganglion cell complex analysis using spectral domain optical coherence tomography for glaucoma assessment. World J Ophthalmol 2015; 5(2): 86-98
- URL: https://www.wjgnet.com/2218-6239/full/v5/i2/86.htm
- DOI: https://dx.doi.org/10.5318/wjo.v5.i2.86


