Copyright
©The Author(s) 2017.
World J Clin Oncol. Oct 10, 2017; 8(5): 405-411
Published online Oct 10, 2017. doi: 10.5306/wjco.v8.i5.405
Published online Oct 10, 2017. doi: 10.5306/wjco.v8.i5.405
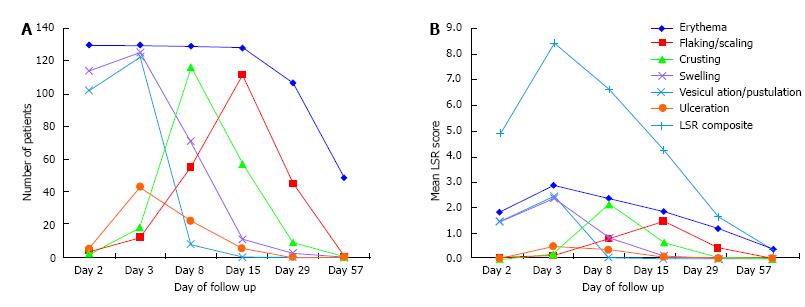
Figure 2 Number of skin reactions and scores at each follow up visit.
A: The number and features of different skin reactions over the time; B: Mean values describing the severity of each skin reaction and the LSR composite score (light blue line). Skin reactions included: Erythema (blue), flaking/scaling (red), crusting (green), swelling (purple), vesiculation/pustulation (light blue), and ulceration (orange). LSR: Local skin reaction.
- Citation: Skroza N, Proietti I, Bernardini N, Balduzzi V, Mambrin A, Marchesiello A, Tolino E, Zuber S, La Torre G, Potenza C. Factors influencing response to ingenol mebutate therapy for actinic keratosis of face and scalp. World J Clin Oncol 2017; 8(5): 405-411
- URL: https://www.wjgnet.com/2218-4333/full/v8/i5/405.htm
- DOI: https://dx.doi.org/10.5306/wjco.v8.i5.405


