Copyright
©The Author(s) 2017.
World J Clin Oncol. Aug 10, 2017; 8(4): 305-319
Published online Aug 10, 2017. doi: 10.5306/wjco.v8.i4.305
Published online Aug 10, 2017. doi: 10.5306/wjco.v8.i4.305
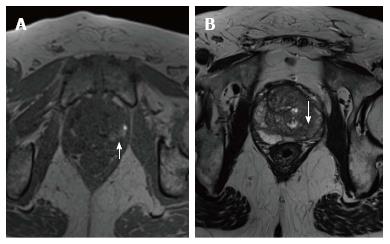
Figure 2 T1 (A) and T2-weighted images (B) of the midgland of the prostate.
The left peripheral zone has a hyperintense area (white arrow, A) in T1-weighted image that correlates with a hypointensity (white arrow in B) in T2-weighted image, suggestive of bleeding in a patient with a recent transrectal ultrasound prostate biopsy.
- Citation: Couñago F, Sancho G, Catalá V, Hernández D, Recio M, Montemuiño S, Hernández JA, Maldonado A, del Cerro E. Magnetic resonance imaging for prostate cancer before radical and salvage radiotherapy: What radiation oncologists need to know. World J Clin Oncol 2017; 8(4): 305-319
- URL: https://www.wjgnet.com/2218-4333/full/v8/i4/305.htm
- DOI: https://dx.doi.org/10.5306/wjco.v8.i4.305


