Copyright
©The Author(s) 2017.
World J Clin Oncol. Jun 10, 2017; 8(3): 285-288
Published online Jun 10, 2017. doi: 10.5306/wjco.v8.i3.285
Published online Jun 10, 2017. doi: 10.5306/wjco.v8.i3.285
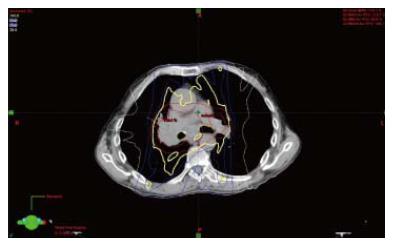
Figure 1 Intensity modulated radiation therapy radiation plan.
The yellow line represents the 100% isodose line, blue lines represent the 90% and 50% isodose lines, and the white line represents the 20% isodose line. The red lines represent the gross tumor and planning treatment volumes (GTV and PTV).
- Citation: Osborn VW, Leaf A, Lee A, Garay E, Safdieh J, Schwartz D, Schreiber D. Bilateral diffuse grade 5 radiation pneumonitis after intensity modulated radiation therapy for localized lung cancer. World J Clin Oncol 2017; 8(3): 285-288
- URL: https://www.wjgnet.com/2218-4333/full/v8/i3/285.htm
- DOI: https://dx.doi.org/10.5306/wjco.v8.i3.285


