Copyright
©2014 Baishideng Publishing Group Inc.
World J Clin Oncol. Dec 10, 2014; 5(5): 931-965
Published online Dec 10, 2014. doi: 10.5306/wjco.v5.i5.931
Published online Dec 10, 2014. doi: 10.5306/wjco.v5.i5.931
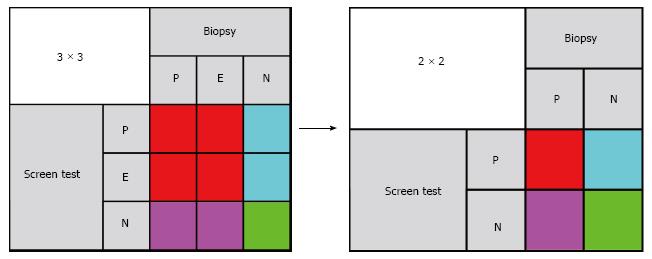
Figure 21 Mapping of 3 × 3 to 2 × 2 tables for sensitivity, specificity and negative predictive value.
- Citation: Garner D. Clinical application of DNA ploidy to cervical cancer screening: A review. World J Clin Oncol 2014; 5(5): 931-965
- URL: https://www.wjgnet.com/2218-4333/full/v5/i5/931.htm
- DOI: https://dx.doi.org/10.5306/wjco.v5.i5.931


