Copyright
©2014 Baishideng Publishing Group Inc.
World J Clin Oncol. Dec 10, 2014; 5(5): 824-844
Published online Dec 10, 2014. doi: 10.5306/wjco.v5.i5.824
Published online Dec 10, 2014. doi: 10.5306/wjco.v5.i5.824
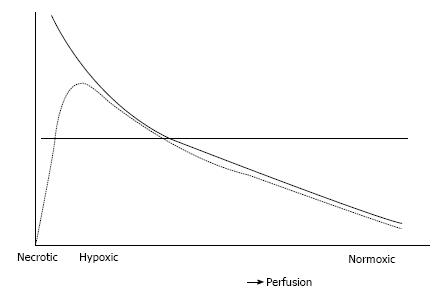
Figure 4 Representation of hypothetical considerations on the link between perfusion and the hypoxia signal as measured by imaging positron emission tomography.
The continuous curve represents hypothetical level of hypoxia in tissue for increasing levels of perfusion (i.e., closer to the capillaries). The dotted line represents the positron emission tomography signal obtained from hypoxia imaging using an optimal imaging protocol. The horizontal line represents a threshold used for delineation of hypoxic areas.
- Citation: Verwer EE, Boellaard R, Veldt AAVD. Positron emission tomography to assess hypoxia and perfusion in lung cancer. World J Clin Oncol 2014; 5(5): 824-844
- URL: https://www.wjgnet.com/2218-4333/full/v5/i5/824.htm
- DOI: https://dx.doi.org/10.5306/wjco.v5.i5.824


