Copyright
©2014 Baishideng Publishing Group Inc.
World J Clin Oncol. Dec 10, 2014; 5(5): 824-844
Published online Dec 10, 2014. doi: 10.5306/wjco.v5.i5.824
Published online Dec 10, 2014. doi: 10.5306/wjco.v5.i5.824
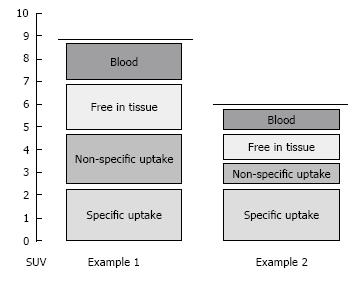
Figure 1 Graphical representation of the different components that determine the total positron emission tomography signal.
Examples 1 and 2 can represent either different patients, different lesions in one patient or different scans of one patient, for example before and after therapy. In both examples the contributions of specific uptake (the uptake of interest) are equal, but the total signal is different due to differences in contribution of other (non-relevant) signals. Measured standardized uptake value (SUV) values are reflected by the dashed lines. As SUV does not only reflect the specific signal, its use should be validated before it is used in a clinical setting, i.e., it is required to assess if contributions from non-specific signals affect SUV values in a non-predictable way. For the purpose of illustration, the Y-axis represents SUV values on an arbitrarily chosen scale.
- Citation: Verwer EE, Boellaard R, Veldt AAVD. Positron emission tomography to assess hypoxia and perfusion in lung cancer. World J Clin Oncol 2014; 5(5): 824-844
- URL: https://www.wjgnet.com/2218-4333/full/v5/i5/824.htm
- DOI: https://dx.doi.org/10.5306/wjco.v5.i5.824


