Copyright
©2011 Baishideng Publishing Group Co.
World J Clin Oncol. May 10, 2011; 2(5): 217-224
Published online May 10, 2011. doi: 10.5306/wjco.v2.i5.217
Published online May 10, 2011. doi: 10.5306/wjco.v2.i5.217
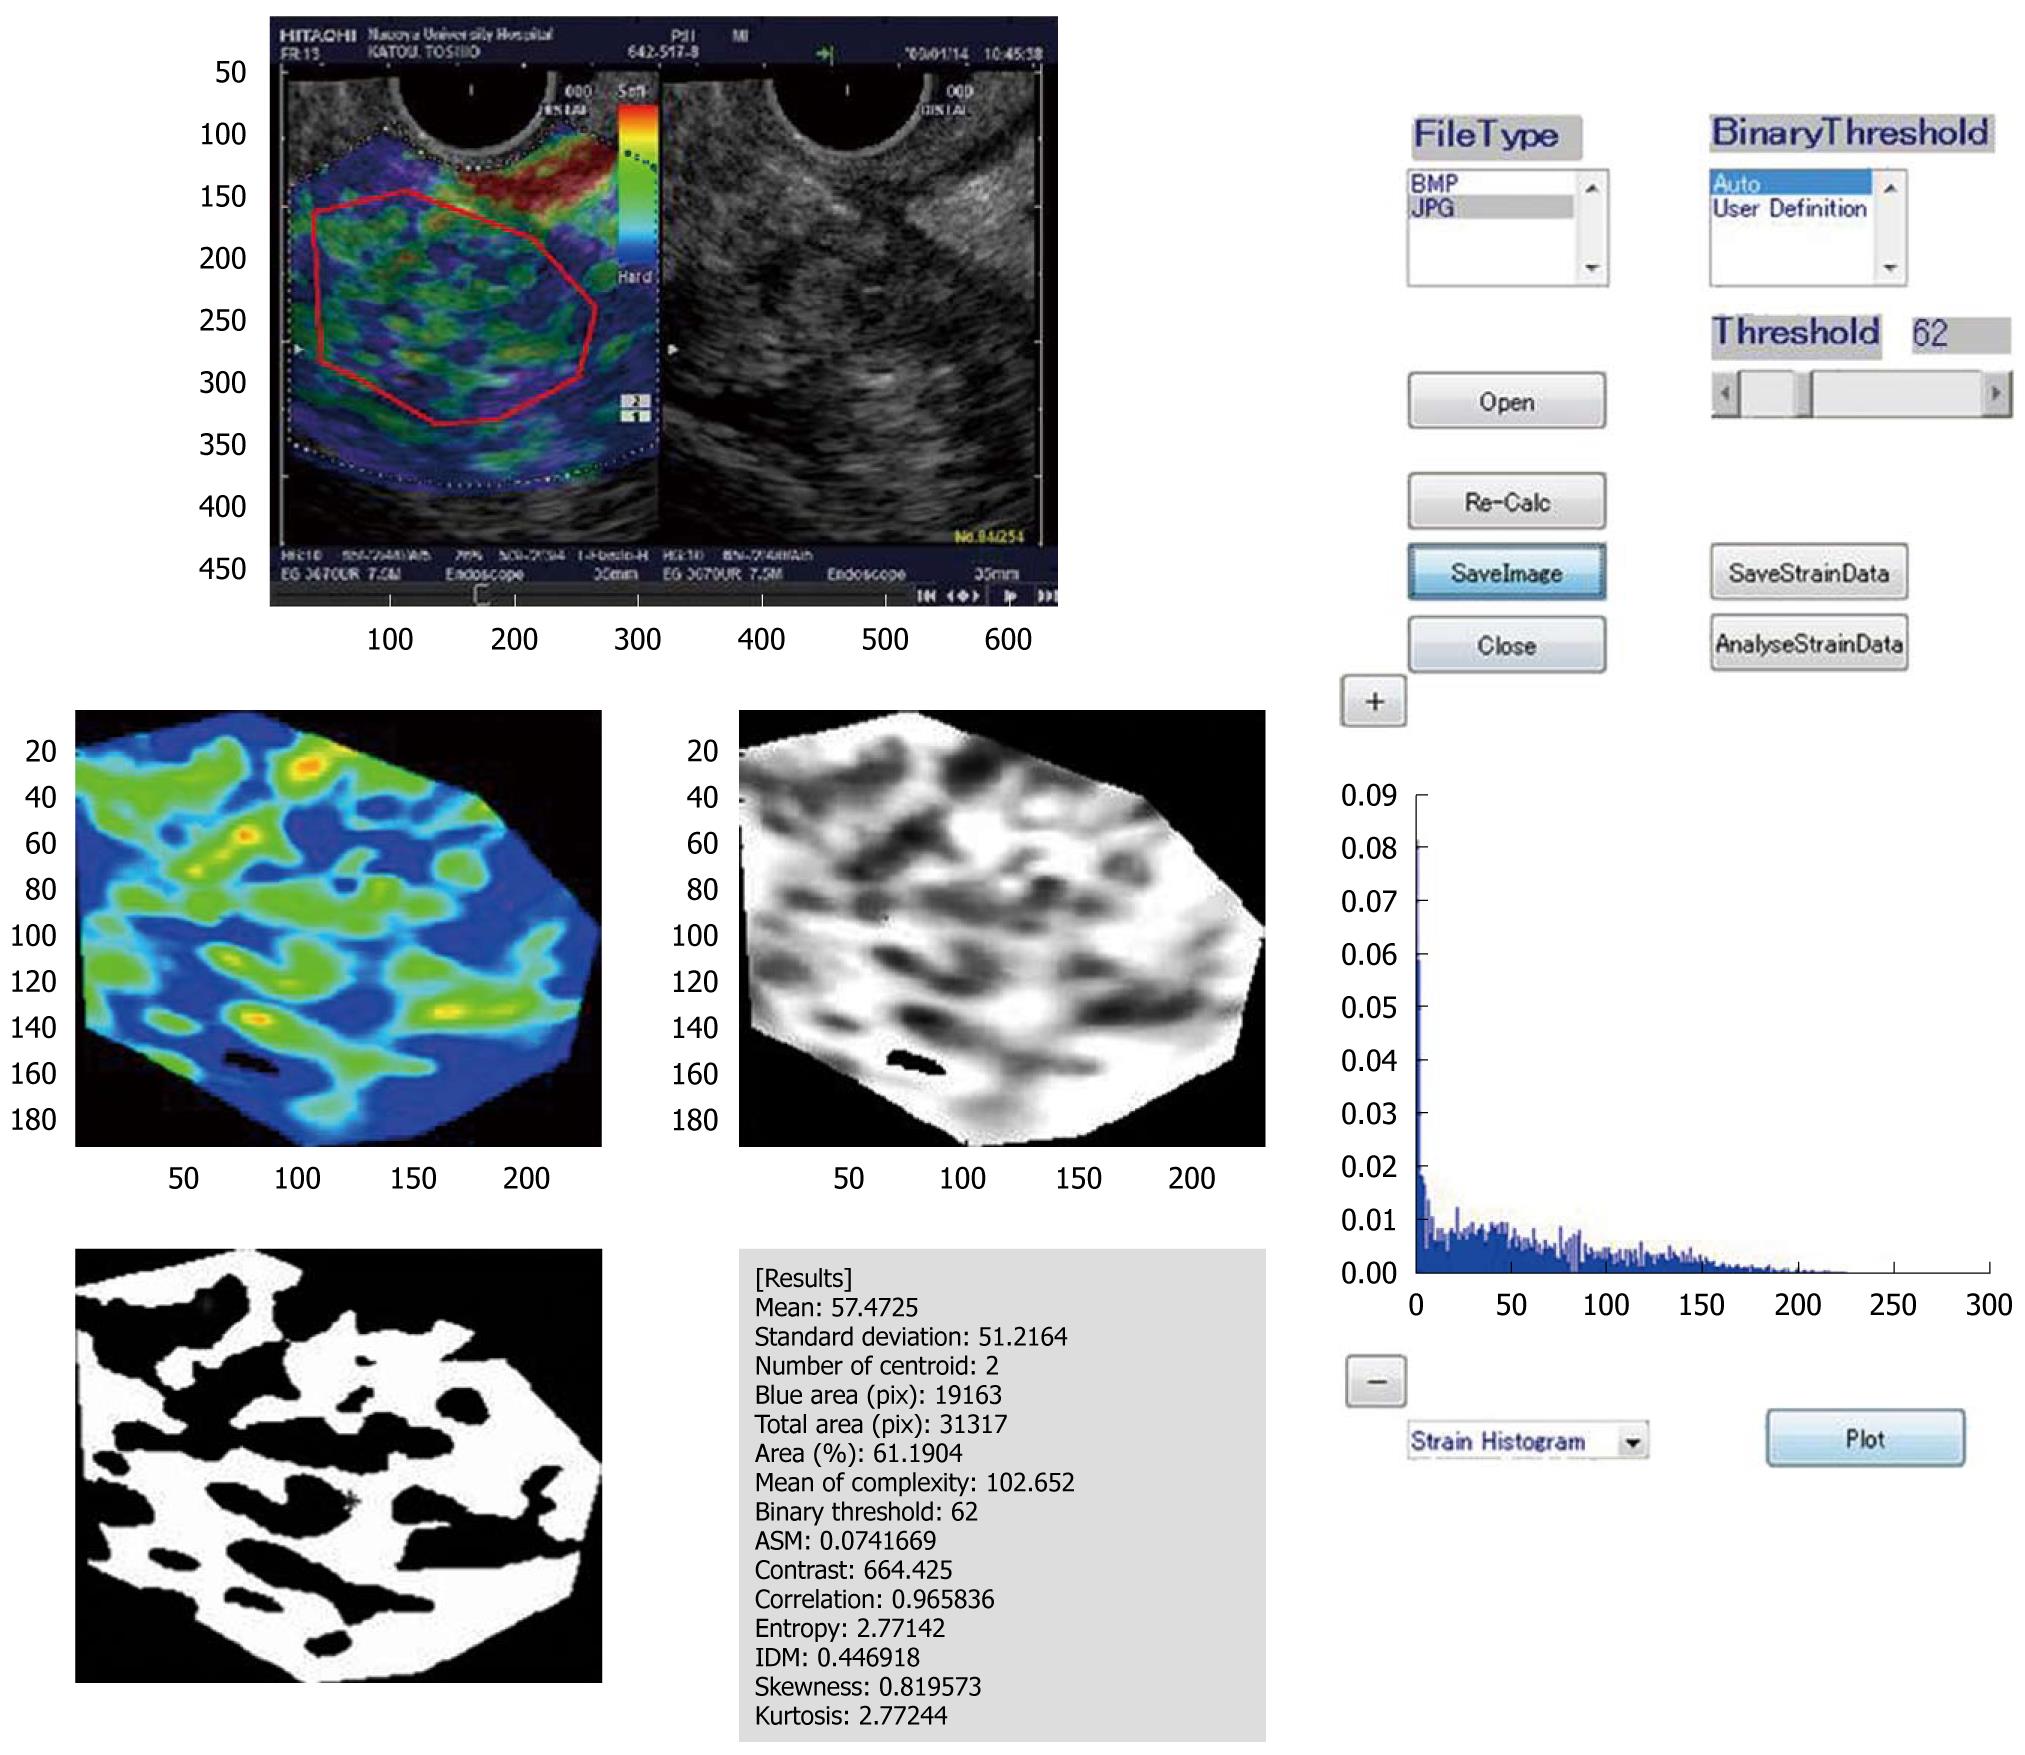
Figure 10 Prototype image analysis software (chronic pancreatitis in this case).
The prototype image analysis software used here extracts various features from real-time tissue elastography images. It converts the red-green-blue value inside the region of interest of the elastography image into a relative strain value and calculates other features of the elastography image, such as the mean of the relative strain value, the standard deviation of the relative strain value, and the proportion of the blue (low strain) region in the analysis region, and determines the complexity of the blue (low strain) region in the analysis region [(Perimeter of blue region)2/(Area of blue region)].
- Citation: Hirooka Y, Itoh A, Kawashima H, Ohno E, Ishikawa T, Itoh Y, Nakamura Y, Hiramatsu T, Nakamura M, Miyahara R, Ohmiya N, Ishigami M, Katano Y, Goto H. Clinical oncology for pancreatic and biliary cancers: Advances and current limitations. World J Clin Oncol 2011; 2(5): 217-224
- URL: https://www.wjgnet.com/2218-4333/full/v2/i5/217.htm
- DOI: https://dx.doi.org/10.5306/wjco.v2.i5.217


