Copyright
©2011 Baishideng Publishing Group Co.
World J Clin Oncol. Jan 10, 2011; 2(1): 28-43
Published online Jan 10, 2011. doi: 10.5306/wjco.v2.i1.28
Published online Jan 10, 2011. doi: 10.5306/wjco.v2.i1.28
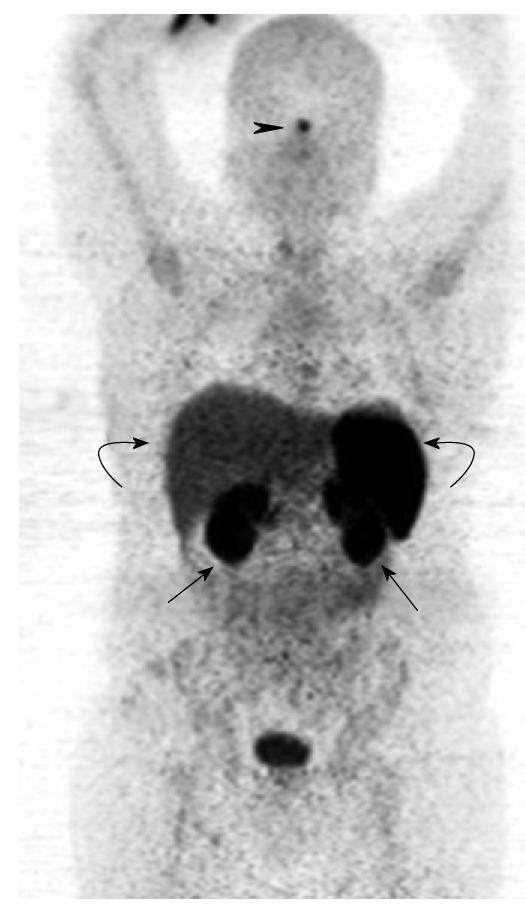
Figure 6 Gallium 68 DOTATATE positron emission tomography from the skull vertex to mid-thigh.
The coronal maximum intensity projection image demonstrates physiological areas of tracer uptake in the pituitary (black arrowhead), kidneys (black arrows), liver and spleen (curved arrows).
- Citation: Tan EH, Tan CH. Imaging of gastroenteropancreatic neuroendocrine tumors. World J Clin Oncol 2011; 2(1): 28-43
- URL: https://www.wjgnet.com/2218-4333/full/v2/i1/28.htm
- DOI: https://dx.doi.org/10.5306/wjco.v2.i1.28


