
















Copyright: ©Author(s) 2026.
World J Clin Oncol. Sep 24, 2026; 17(9): 122878
Published online Sep 24, 2026. doi: 10.5306/wjco.122878
Published online Sep 24, 2026. doi: 10.5306/wjco.122878
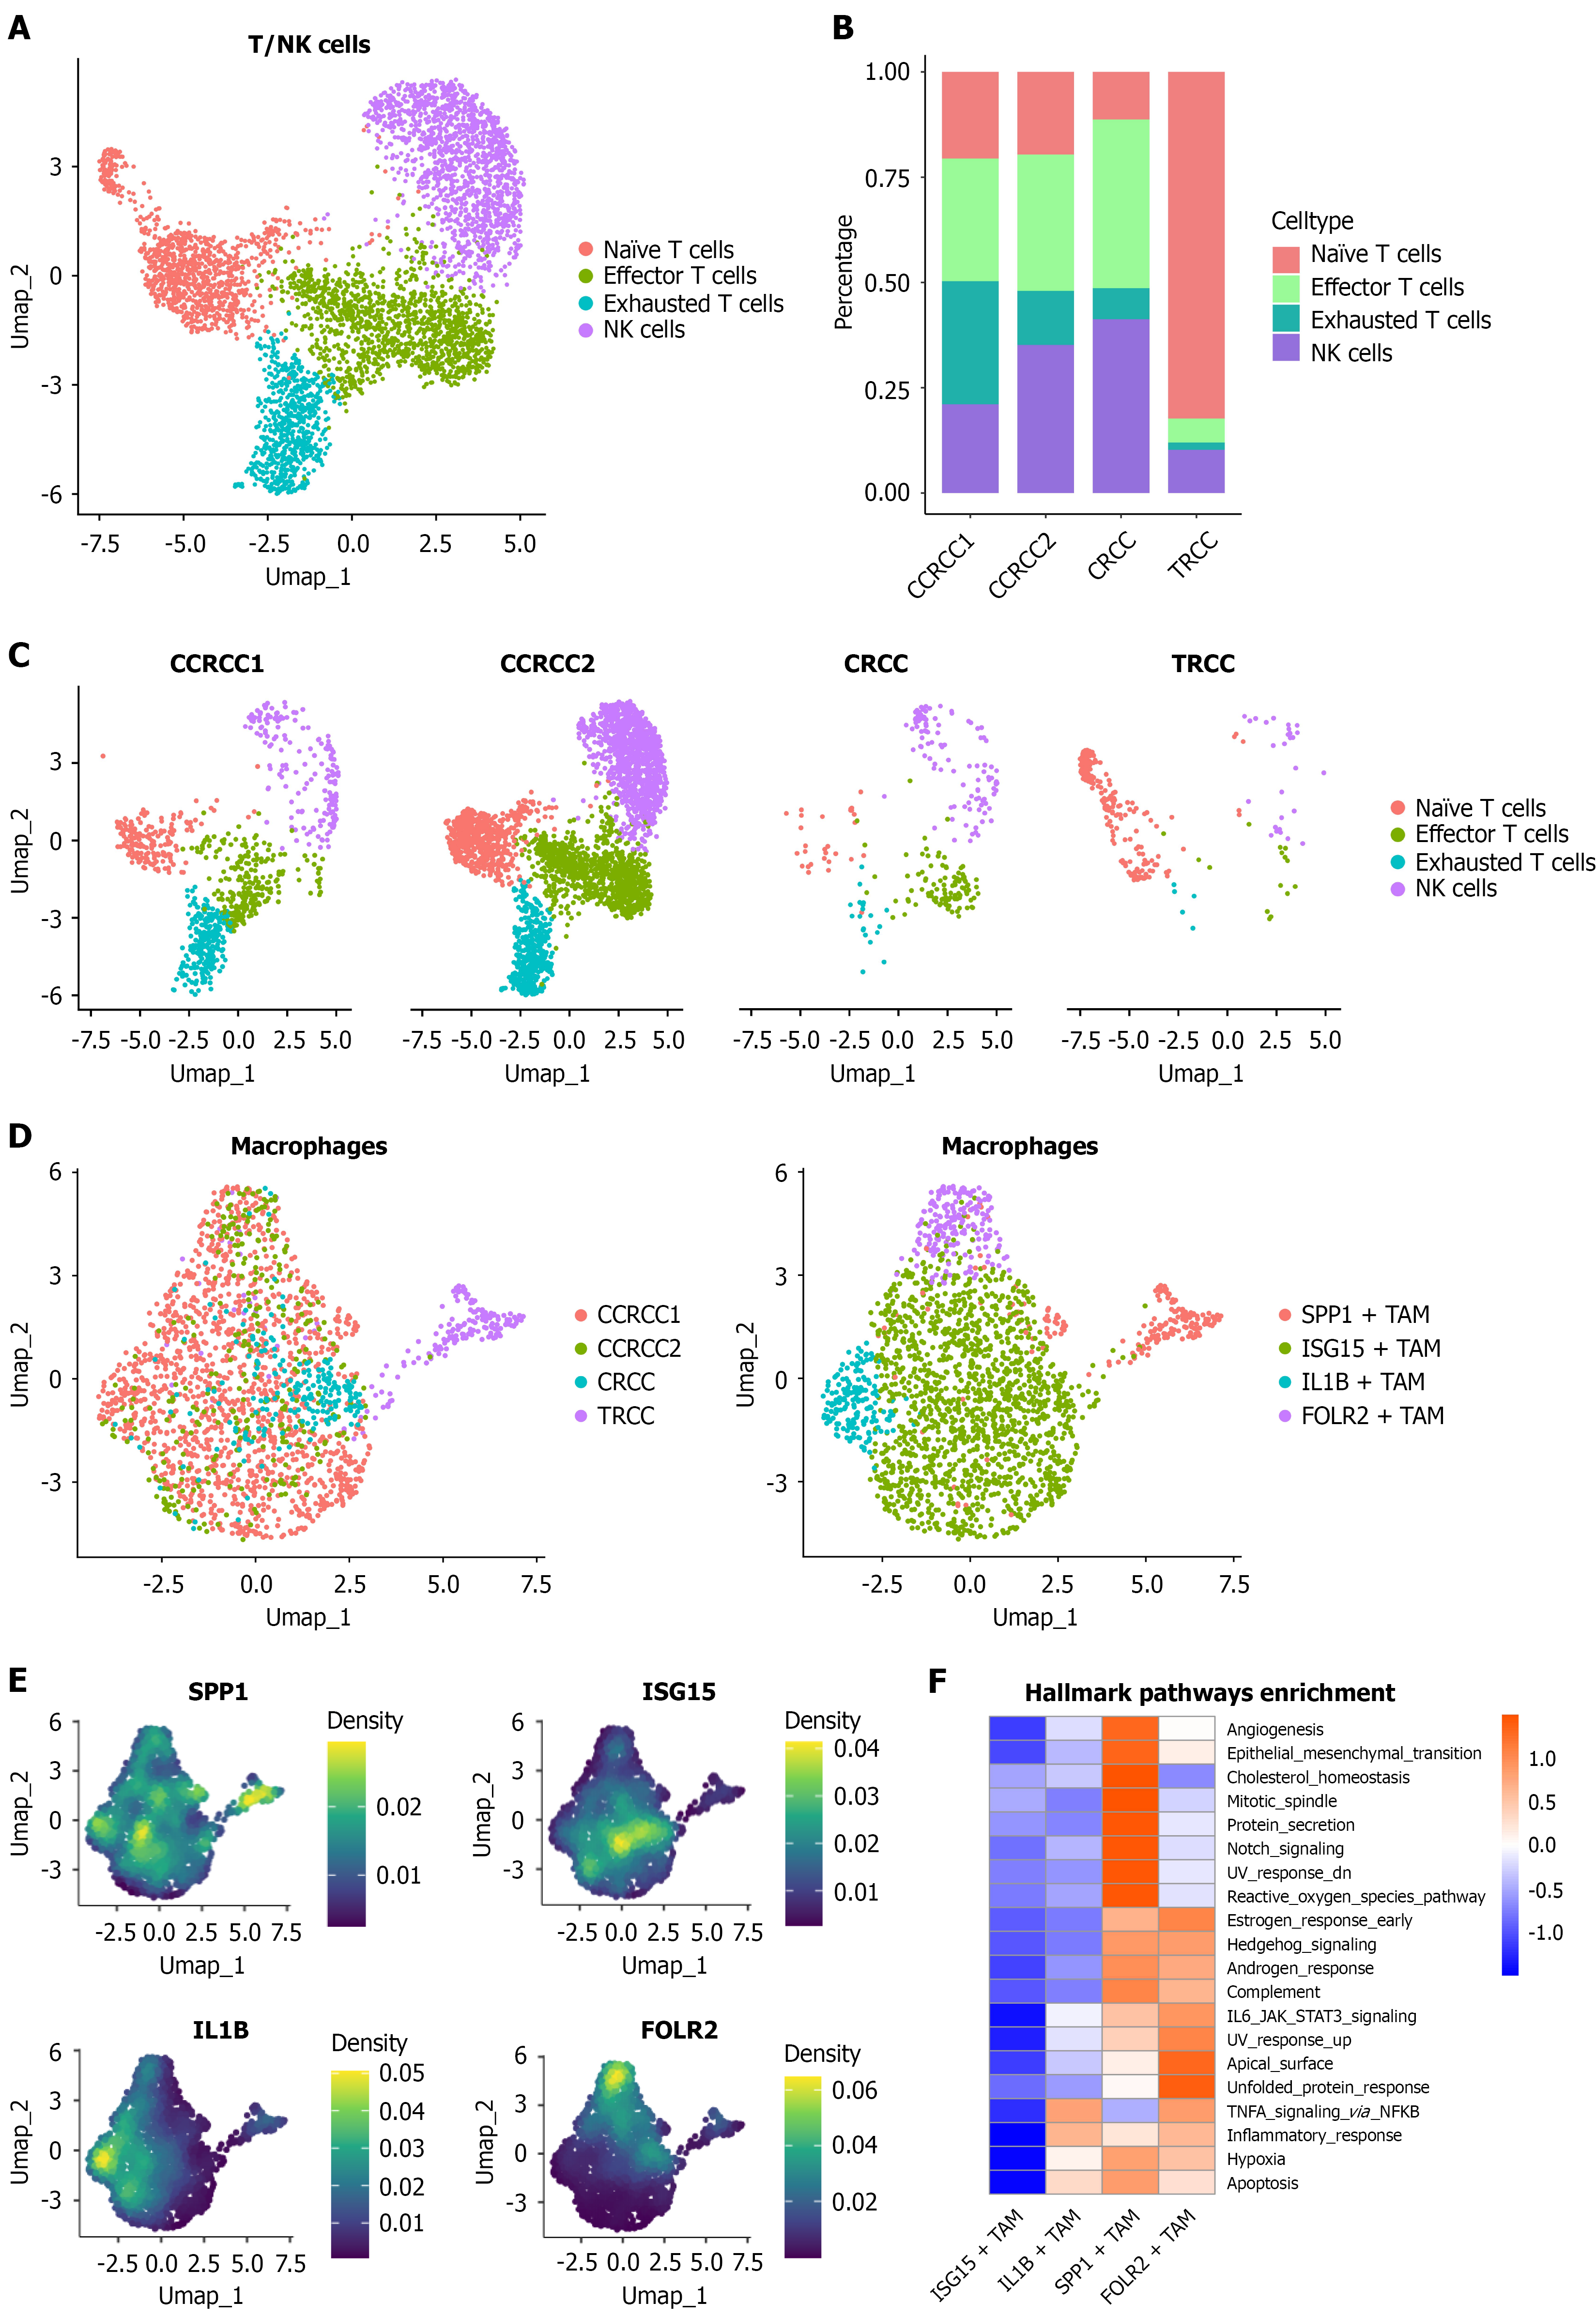
Figure 3 Single-cell analysis delineates the immune microenvironment characteristics of tubulocystic renal cell carcinoma.
A: UMAP plots illustrating signature genes across distinct T/NK cell subpopulations: Naïve T cells, Effector T cells, Exhausted T cells, and NK cells; B: Bar chart comparing proportions of T/NK cell subpopulations across different histological subtypes of renal cell carcinoma; C: UMAP plots demonstrating the distribution of T/NK cell subpopulations across various types of renal cell carcinoma; D: UMAP plots illustrating signature genes across distinct macrophage subpopulations; E: Density plots depicting the distribution of signature genes across macrophage populations; F: GSVA enrichment analysis of macrophage subclusters showing elevated HALLMARK_ANGIOGENESIS scores in SPP1+ TAMs compared to other macrophage subclusters. CRCC: Chromophobe renal cell carcinoma; TRCC: Tubulocystic renal cell carcinoma; CCRCC: Clear cell renal cell carcinoma; TAM: Tumor-associated macrophage; UMAP: Uniform manifold approximation and projection; GSVA: Gene set variation analysis.
- Citation: Zheng CL, Wang Z, Liu GL, Xiao HY, Xie XD, Wang ZQ, Zhang Y, Zhang J, Jiang J, Liu QL, Lan WH. Tubulocystic renal cell carcinoma with aggressive behavior-insights from molecular profiling and single-cell analysis: A case report. World J Clin Oncol 2026; 17(9): 122878
- URL: https://www.wjgnet.com/2218-4333/full/v17/i9/122878.htm
- DOI: https://dx.doi.org/10.5306/wjco.122878