
















Copyright: ©Author(s) 2026.
World J Clin Oncol. Aug 24, 2026; 17(8): 124132
Published online Aug 24, 2026. doi: 10.5306/wjco.124132
Published online Aug 24, 2026. doi: 10.5306/wjco.124132
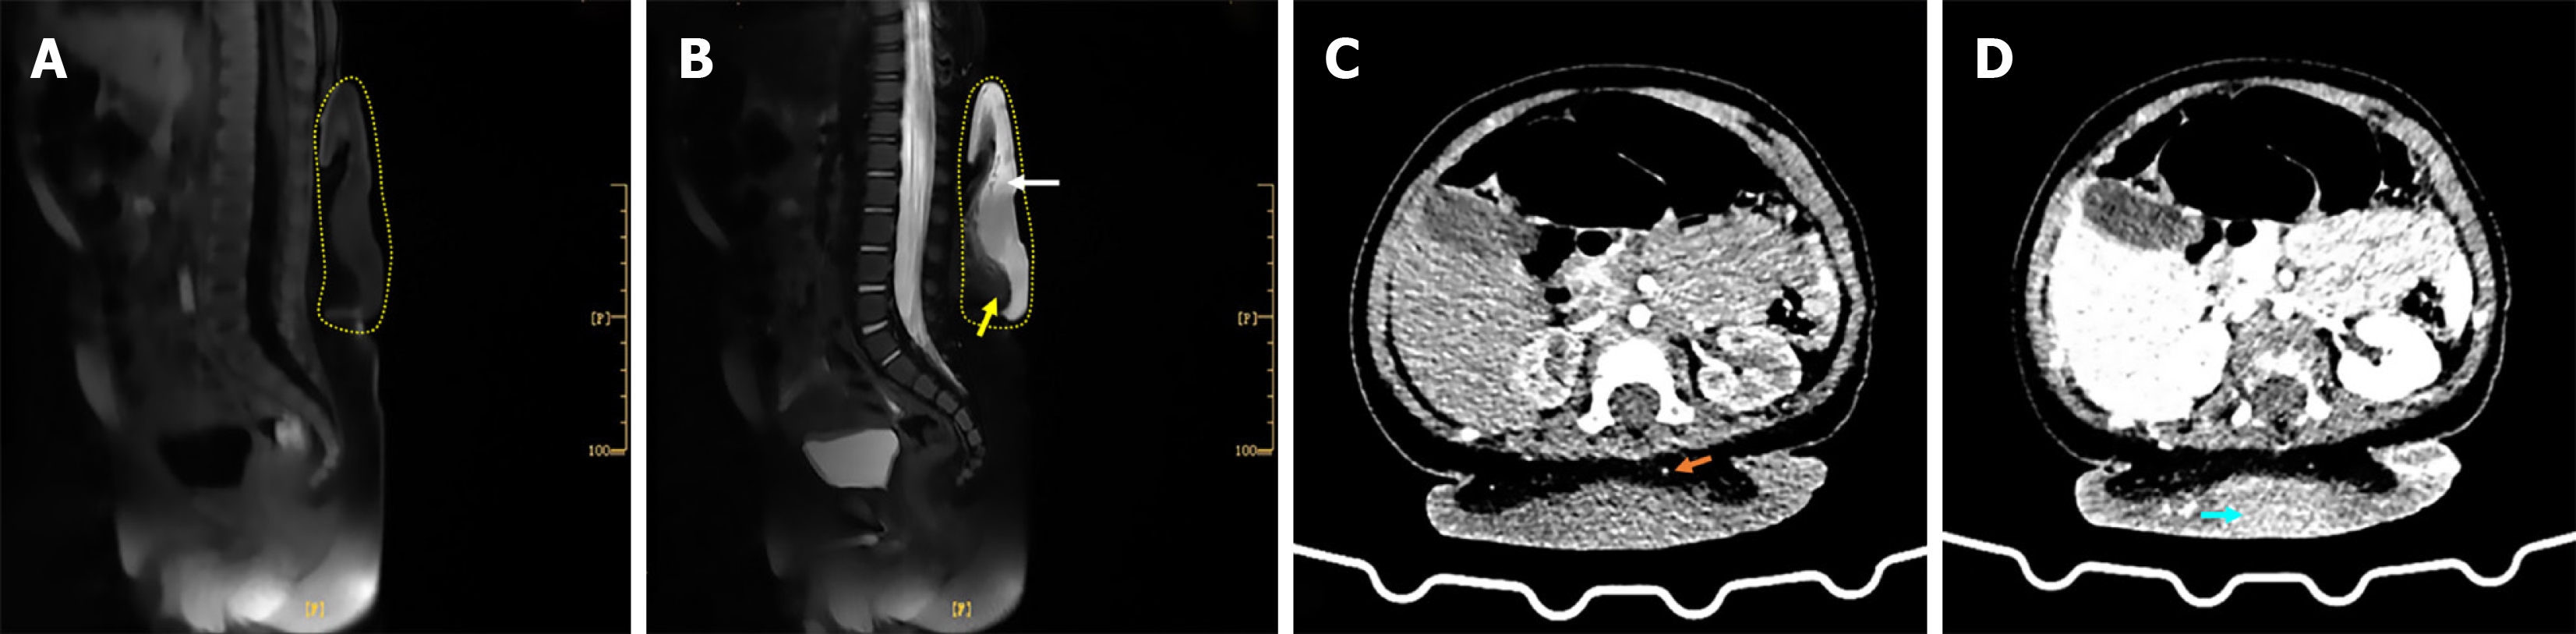
Figure 3 Preoperative imaging findings.
A: Sagittal T1 weighted magnetic resonance imaging showing the extent of the subcutaneous lesion (outlined by the yellow dashed line); B: Sagittal T2-weighted magnetic resonance imaging demonstrating a T2-hyperintense lesion (white arrow) measuring 20 cm × 13.0 cm, with ill-defined margins against the adjacent subcutaneous fat (yellow arrow); C and D: Contrast-enhanced computed tomography obtained during the arterial (C) and venous (D) phases demonstrating a 10.9 cm × 2.7 cm subcutaneous lesion with marked heterogeneous enhancement and no distinct plane separating the lesion from the underlying deep fascia. The orange arrow (C) indicates a tumor vessel, and the blue arrow (D) indicates an area of significant enhancement. Yellow dashed lines outline the lesion boundaries in (A and B).
- Citation: Zheng CJ, Wan CL, Zhang CB, Hai B, Huang CF. Congenital dermatofibrosarcoma protuberans in a seven-month-old infant initially misdiagnosed as infantile myofibroma: A case report. World J Clin Oncol 2026; 17(8): 124132
- URL: https://www.wjgnet.com/2218-4333/full/v17/i8/124132.htm
- DOI: https://dx.doi.org/10.5306/wjco.124132