
















Copyright: ©Author(s) 2026.
World J Clin Oncol. Aug 24, 2026; 17(8): 123351
Published online Aug 24, 2026. doi: 10.5306/wjco.123351
Published online Aug 24, 2026. doi: 10.5306/wjco.123351
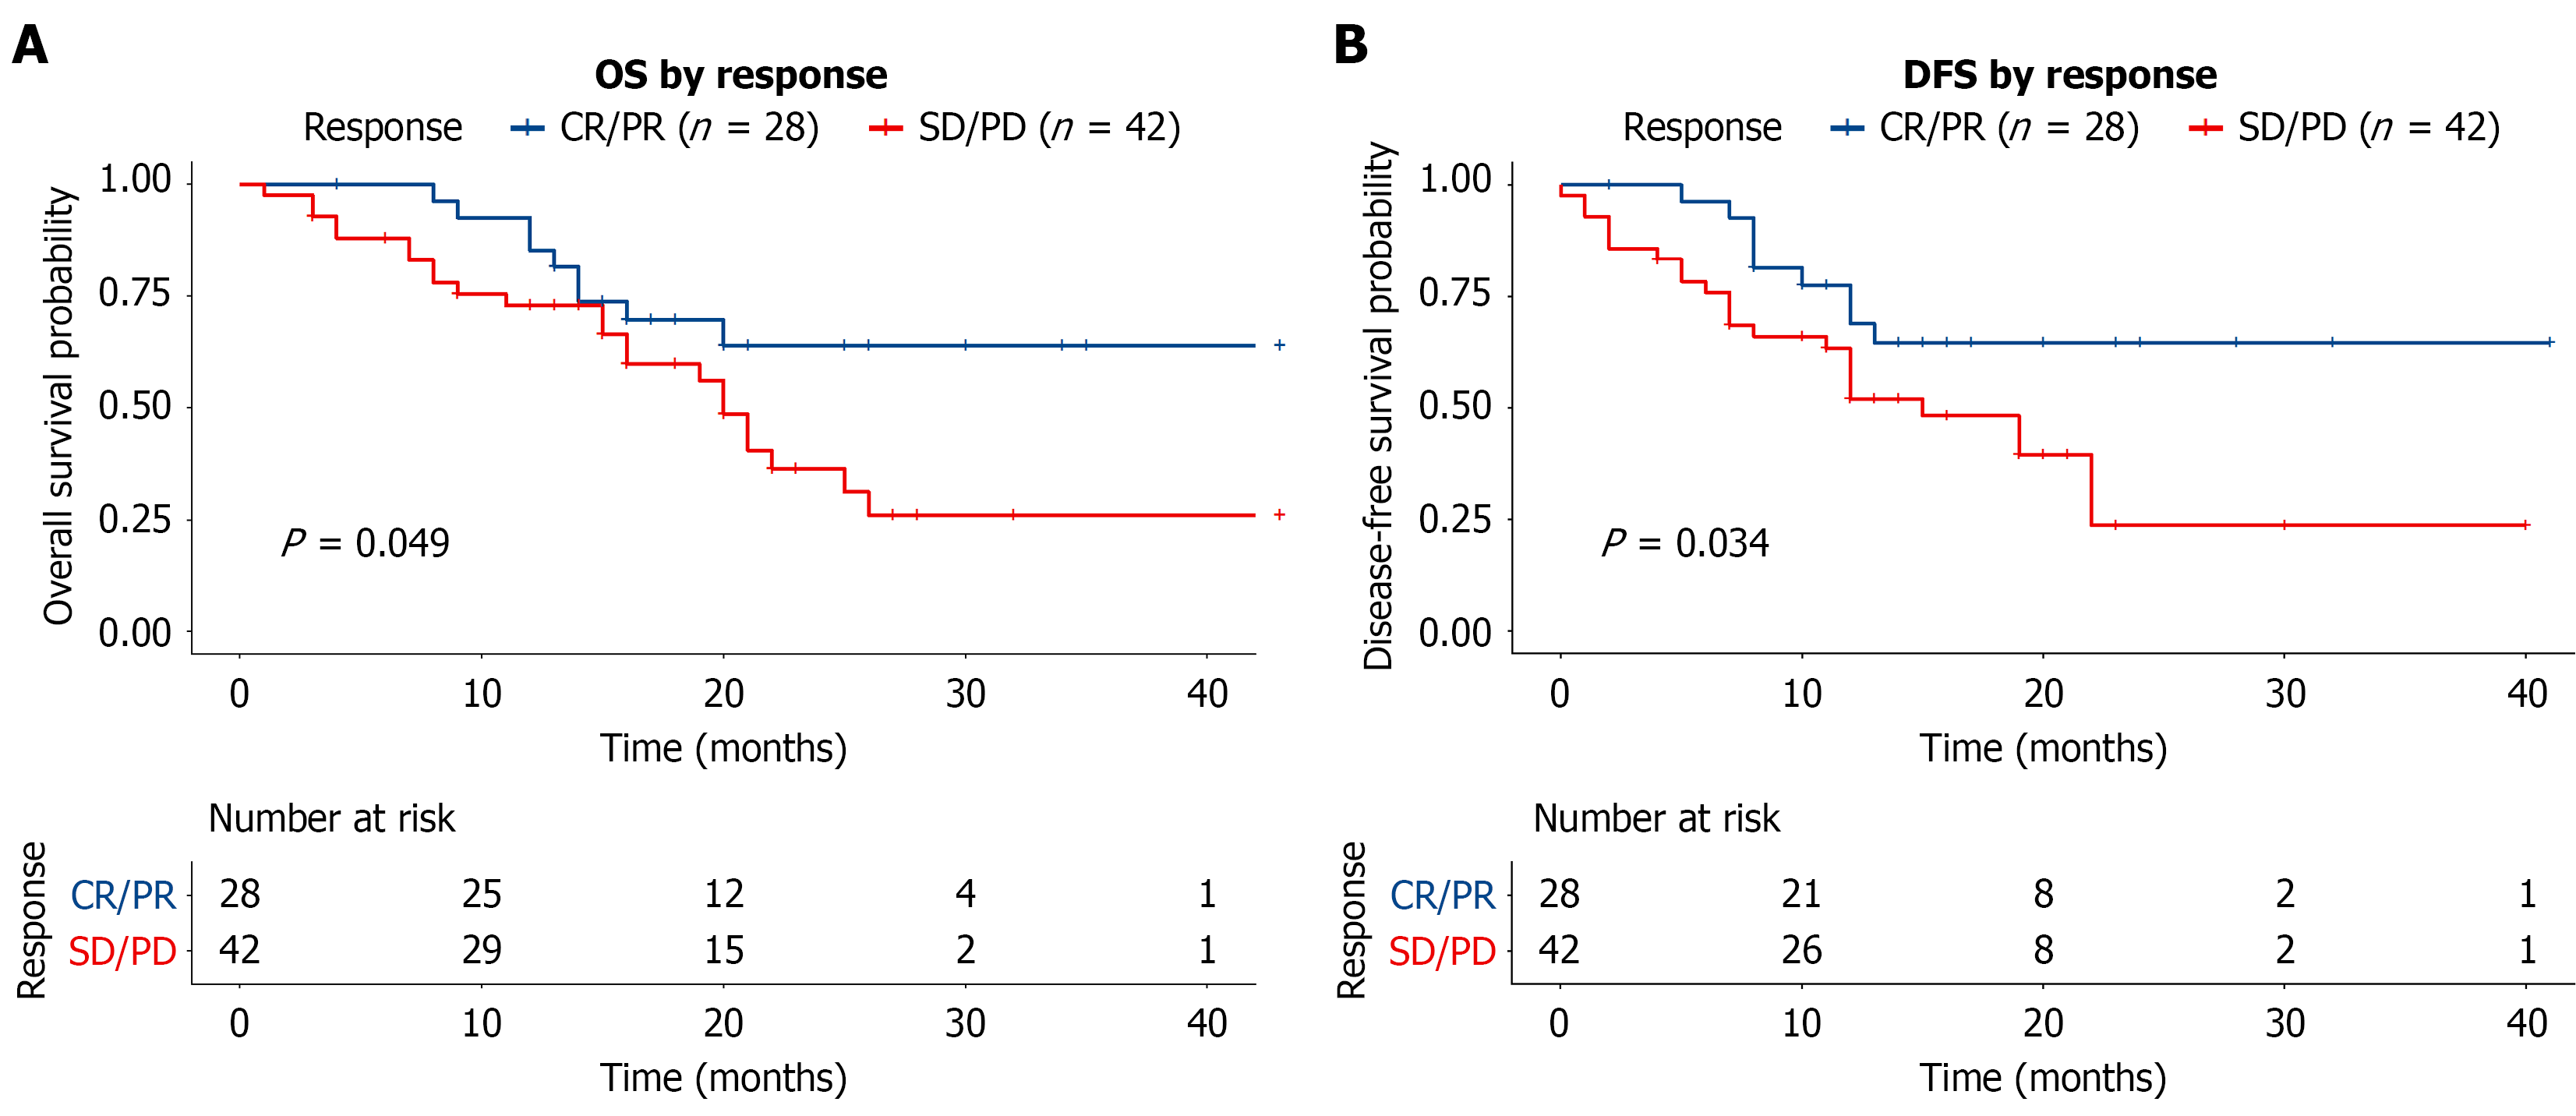
Figure 3 Kaplan-Meier curves of survival outcomes stratified by pathological response.
A: Overall survival in the responder vs non-responder group; B: Disease-free survival in the responder vs non-responder group. OS: Overall survival; DFS: Disease-free survival; CR: Complete response; PR: Partial response; SD: Stable disease; PD: Progressive disease.
- Citation: Wu XX, Yang HD, Min J, Yuan C, Li LS, Zhang W, Tong Y. Neoadjuvant intra-arterial chemoembolization improves tumor pathological regression and survival in Borrmann type IV gastric cancer. World J Clin Oncol 2026; 17(8): 123351
- URL: https://www.wjgnet.com/2218-4333/full/v17/i8/123351.htm
- DOI: https://dx.doi.org/10.5306/wjco.123351