
















Copyright: ©Author(s) 2026.
World J Clin Oncol. Aug 24, 2026; 17(8): 123328
Published online Aug 24, 2026. doi: 10.5306/wjco.123328
Published online Aug 24, 2026. doi: 10.5306/wjco.123328
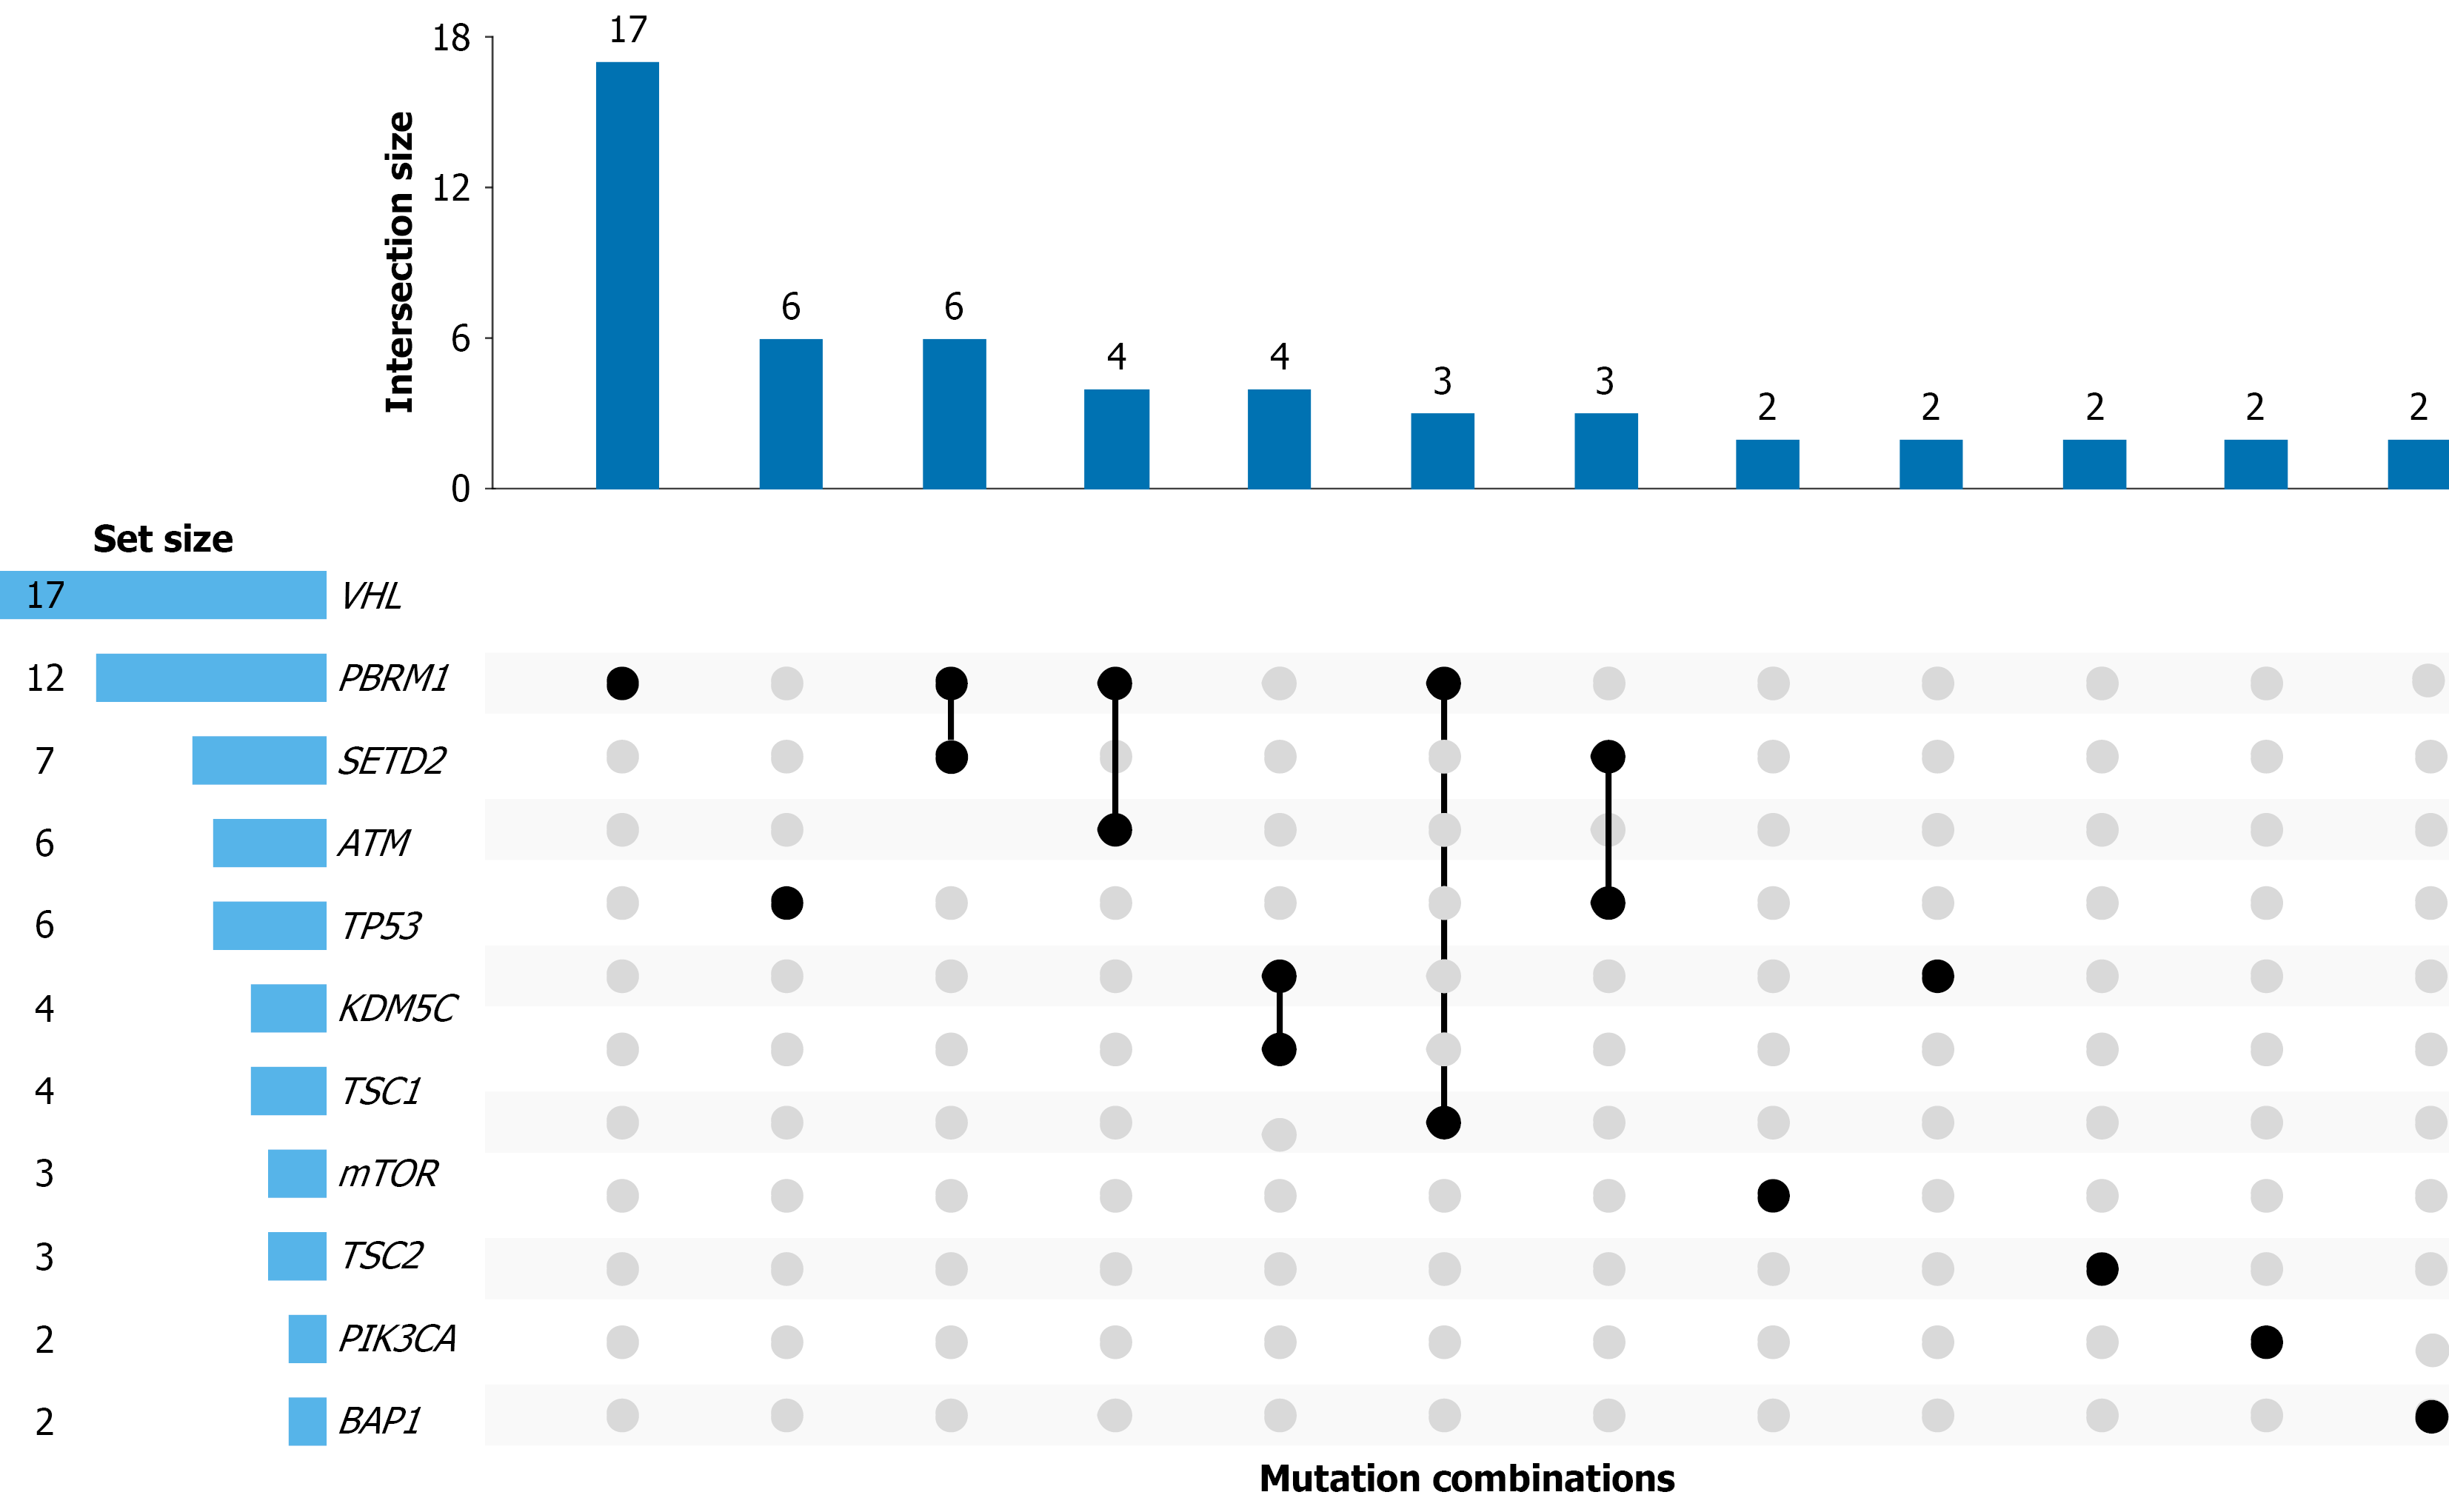
Figure 7 Combinatorial mutation patterns identified by UpSet analysis.
UpSet plot demonstrating the distribution of single-gene and co-occurring genomic alterations among the five most frequently mutated genes (VHL, PBRM1, SETD2, ATM, and TP53). The upper panel shows the number of tumors within each mutational intersection, whereas the lower panel shows the total number of tumors harboring alterations in each gene.
- Citation: Talwar V, Jain A, Goel V, Agarwal B, Gupta P, Tripathi R, Rawal S, Mehta A. Genomic landscape and clinical actionability of renal cell carcinoma in an Indian cohort: A real-world targeted next-generation sequencing study. World J Clin Oncol 2026; 17(8): 123328
- URL: https://www.wjgnet.com/2218-4333/full/v17/i8/123328.htm
- DOI: https://dx.doi.org/10.5306/wjco.123328