
















Copyright: ©Author(s) 2026.
World J Clin Oncol. May 24, 2026; 17(5): 120600
Published online May 24, 2026. doi: 10.5306/wjco.v17.i5.120600
Published online May 24, 2026. doi: 10.5306/wjco.v17.i5.120600
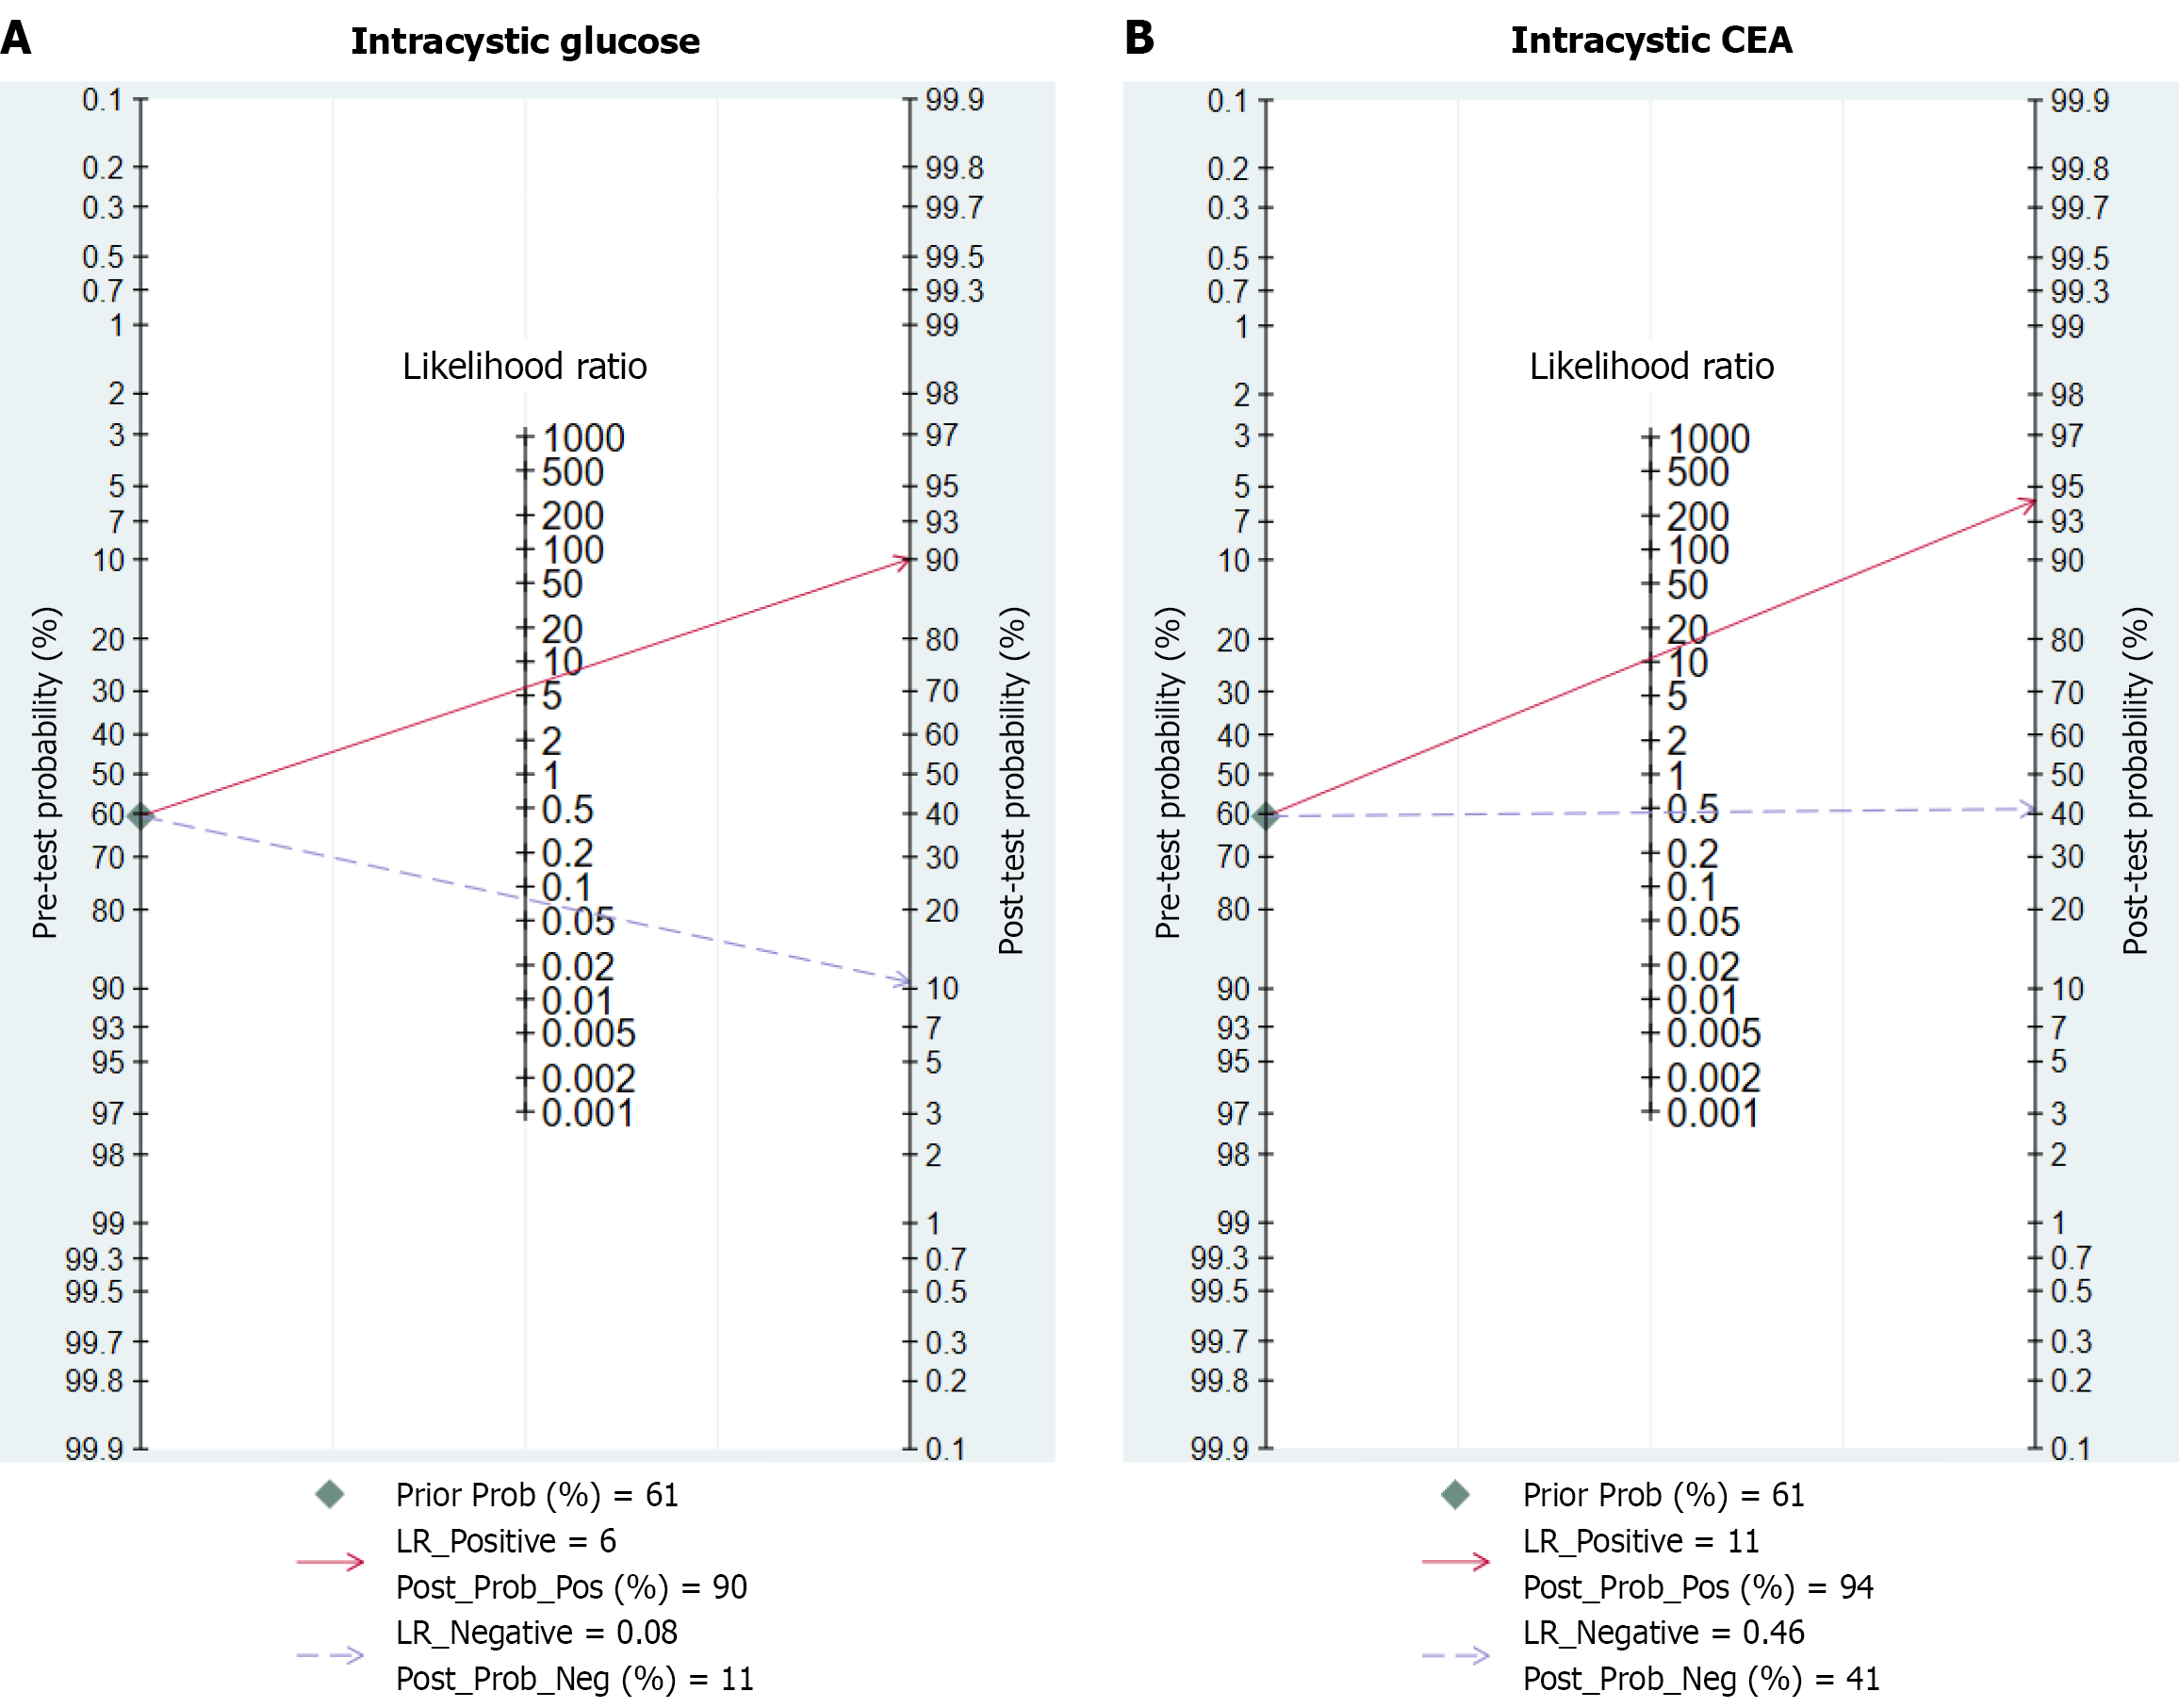
Figure 5 Fagan plots.
A and B: Fagan nomograms illustrating the impact of intracystic glucose (IG) (A) and carcinoembryonic antigen (CEA) (B) on post-test probability, assuming a pre-test probability of 60.6%. The solid red arrows represent the shift in probability after a positive test, while dashed grey arrows represent the shift after a negative test, increasing post-test probability to 90% and 94% for positive IG and CEA, respectively, and reducing it to 11% and 41% for negative results. The legend reports the assumed prior probability (Prior Prob), the positive and negative likelihood ratios (LR_Positive and LR_Negative), and the corresponding post-test probabilities for positive and negative test results (Post_Prob_Pos and Post_Prob_Neg). CEA: Carcinoembryonic antigen.
- Citation: Rizzo GEM, Infantino G, Marchegiani G, Machicado JD, Del Chiaro M, Tarantino I, Rossi G, Arcidiacono PG, Vanella G, Guilabert L, Nikolić S, Capurso G. Intracystic glucose is superior to carcinoembryonic antigen in diagnosing mucinous pancreatic cysts in genomic era: Systematic review and meta-analysis. World J Clin Oncol 2026; 17(5): 120600
- URL: https://www.wjgnet.com/2218-4333/full/v17/i5/120600.htm
- DOI: https://dx.doi.org/10.5306/wjco.v17.i5.120600