
















Copyright: ©Author(s) 2026.
World J Clin Oncol. May 24, 2026; 17(5): 120600
Published online May 24, 2026. doi: 10.5306/wjco.v17.i5.120600
Published online May 24, 2026. doi: 10.5306/wjco.v17.i5.120600
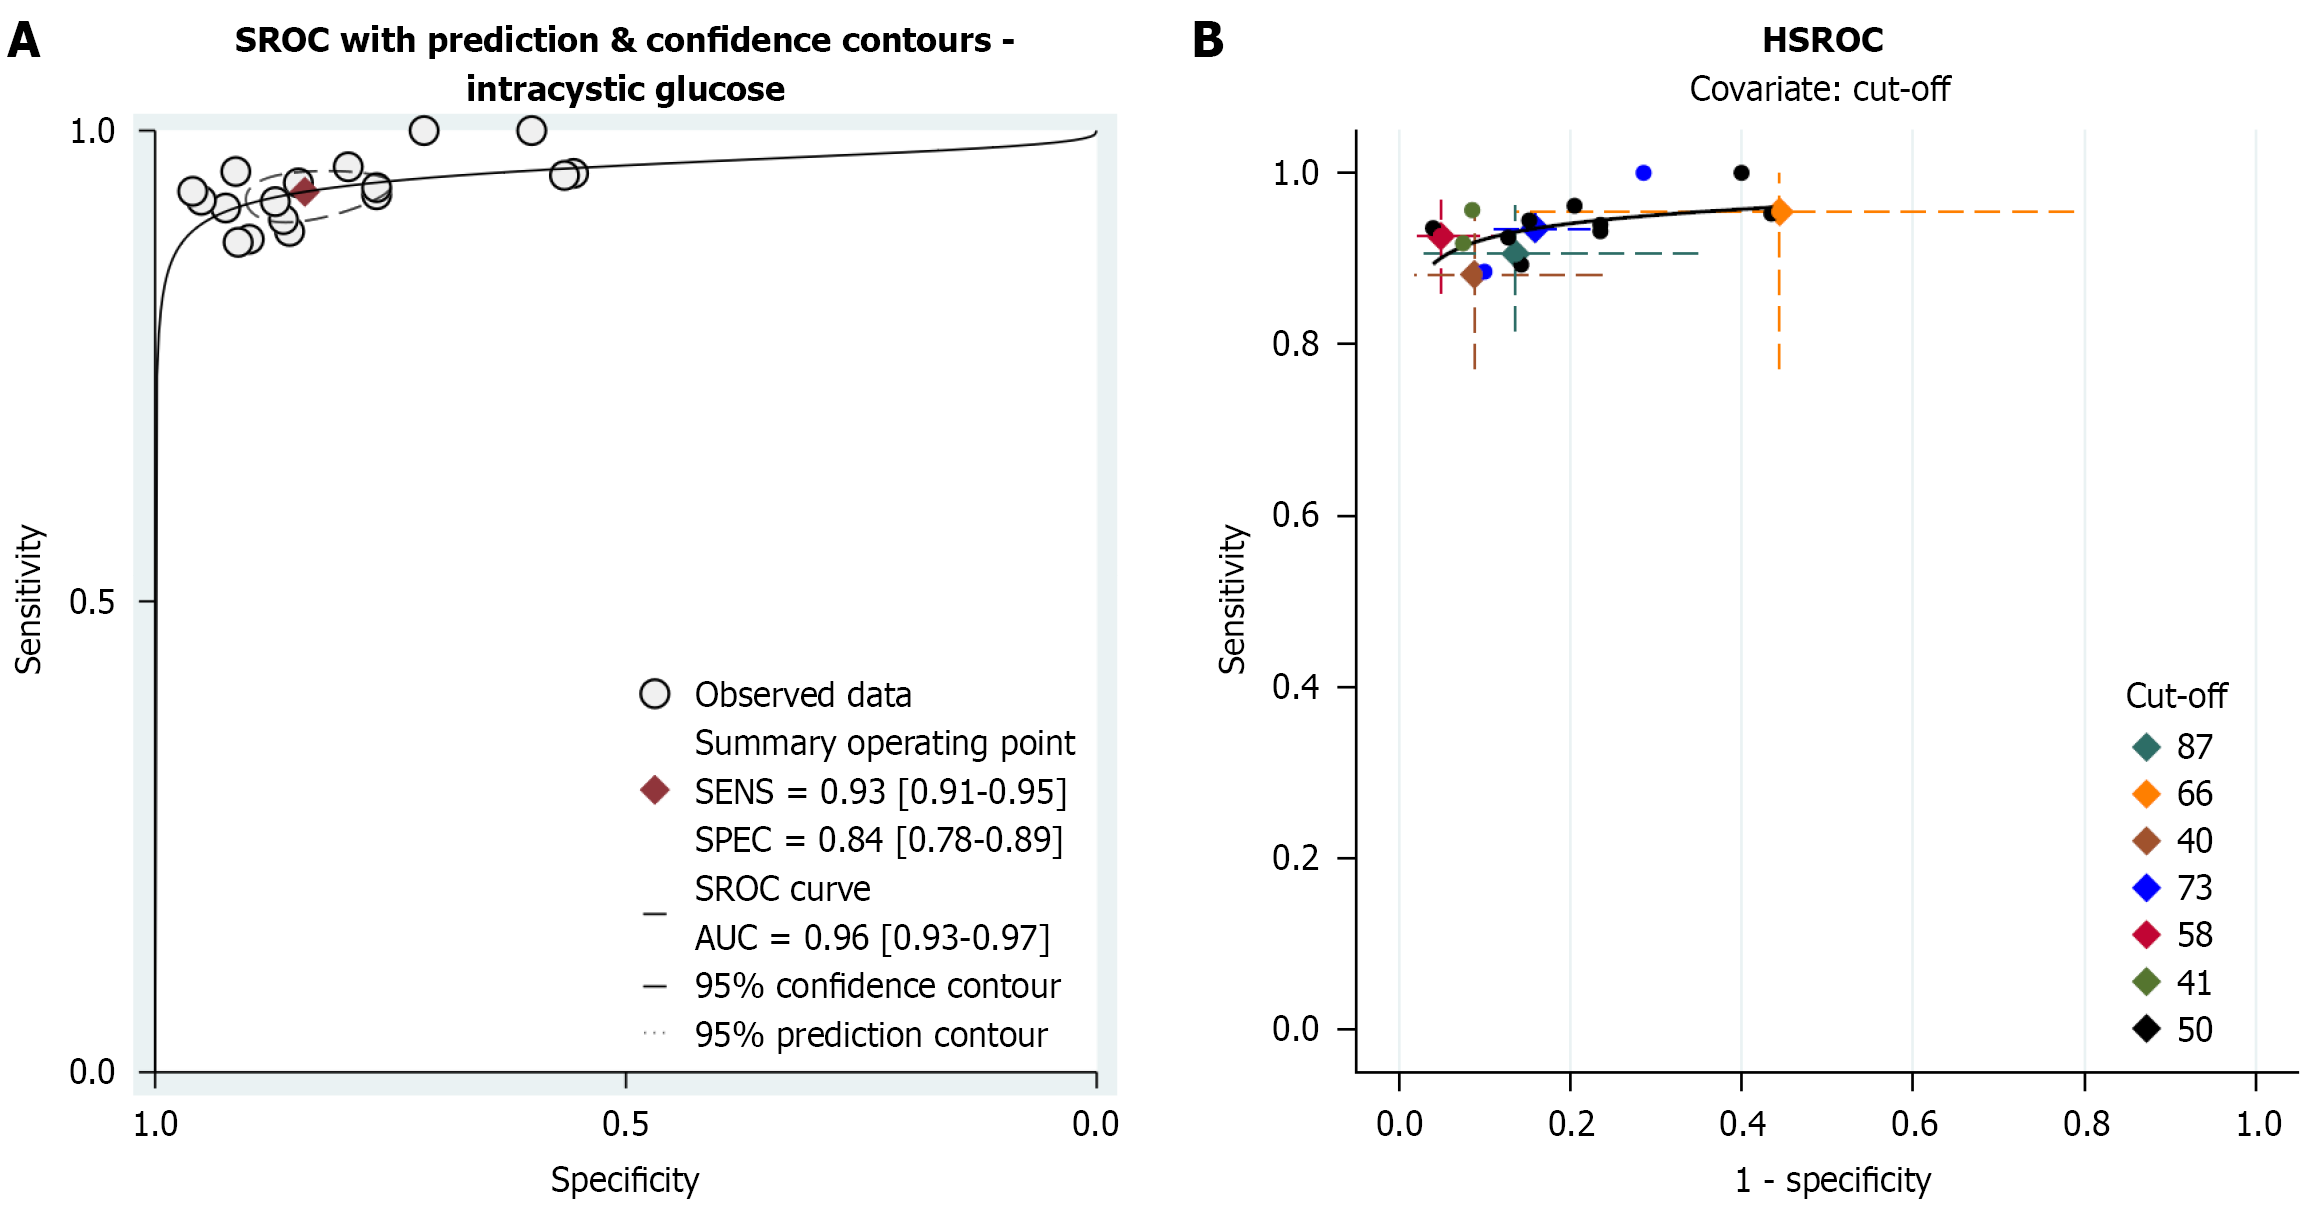
Figure 2 Bivariate and summary receiver operating characteristic analysis confirmed the strong diagnostic performance of intracystic glucose.
A: Bivariate model with summary receiver operating characteristic (SROC) curve for intracystic glucose (IG) in the diagnosis of mucinous pancreatic cysts. Results in the legend are reflected in the location of the summary point (in the upper-left quadrant of the receiver operating characteristic space), and in the shape of the 95% confidence and prediction regions, which were narrow, indicating a minimal threshold effect and consistent results across studies; B: Hierarchical summary receiver operating characteristic (HSROC) considering cut-off thresholds for each study as covariate: Colored dots represent individual studies, with different colors indicating the IG cut-off used in each study (see legend). Dashed horizontal and vertical lines indicate the 95%CI for sensitivity and 1 - specificity, respectively. The solid black curve represents the HSROC curve fitted across all cut-offs. SROC: Summary receiver operating characteristic; IG: Intracystic glucose; HSROC: Hierarchical summary receiver operating characteristic.
- Citation: Rizzo GEM, Infantino G, Marchegiani G, Machicado JD, Del Chiaro M, Tarantino I, Rossi G, Arcidiacono PG, Vanella G, Guilabert L, Nikolić S, Capurso G. Intracystic glucose is superior to carcinoembryonic antigen in diagnosing mucinous pancreatic cysts in genomic era: Systematic review and meta-analysis. World J Clin Oncol 2026; 17(5): 120600
- URL: https://www.wjgnet.com/2218-4333/full/v17/i5/120600.htm
- DOI: https://dx.doi.org/10.5306/wjco.v17.i5.120600