
















Copyright: ©Author(s) 2026.
World J Clin Oncol. May 24, 2026; 17(5): 119275
Published online May 24, 2026. doi: 10.5306/wjco.v17.i5.119275
Published online May 24, 2026. doi: 10.5306/wjco.v17.i5.119275
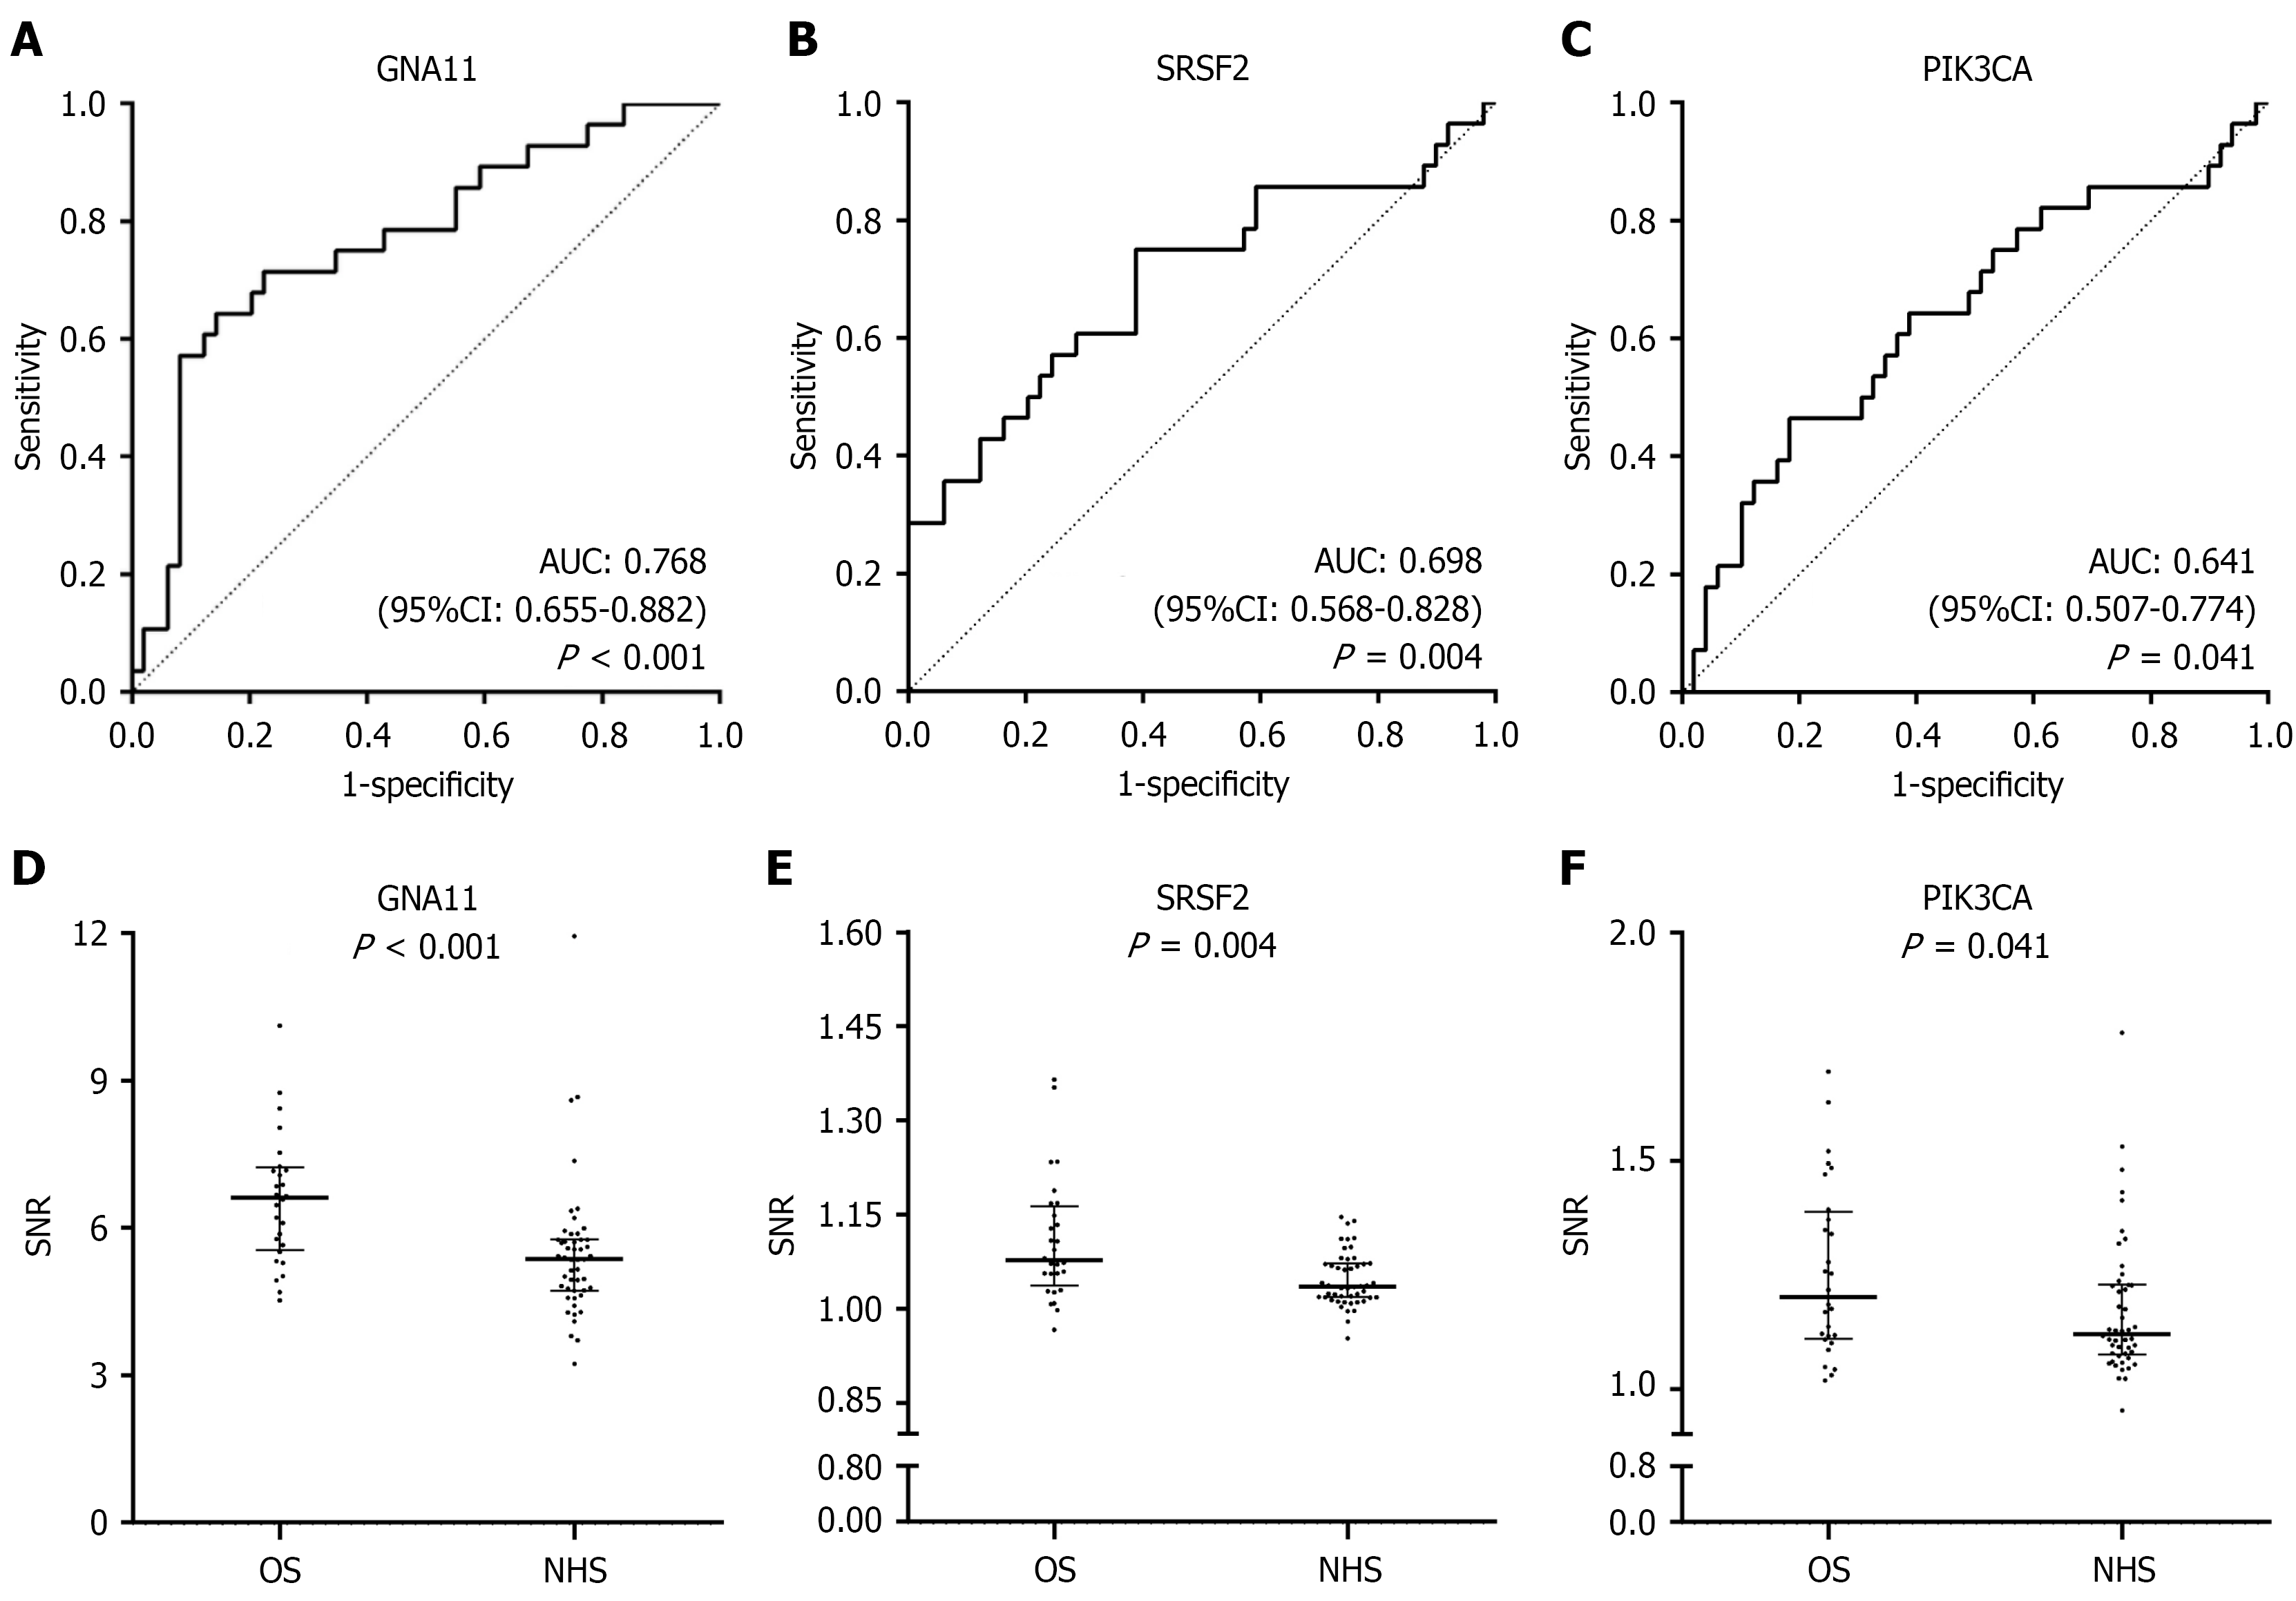
Figure 1 Receiver operator characteristic curve and scatter plots for three anti-tumor associated antigen autoantibodies in the cohort for focused protein microarray.
A-C: Analysis of receiver operator characteristic curve with area under the curve and 95% confidence interval; D-F: Serological levels in signal to noise ratio of three anti-tumor associated antigen autoantibodies in osteosarcoma and normal human sera in scatter plots. The longest line means median, and the 25th percentiles and 75th percentiles are presented by the shorter line. GNA11: G-protein subunit alpha 11; AUC: Area under the curve; CI: Confidence interval; SRSF2: Serine/arginine-rich splicing factor 2; PIK3CA: Phosphatidylinositol-4,5-bisphosphate 3-kinase catalytic subunit alpha; SNR: Signal to noise ratio; OS: Osteosarcoma; NHS: Normal human sera.
- Citation: Ma Y, Wan L, Zhang YY, Luo YG, Yang N, Pu FF, Khan MIU, Liu M, Liu JS, Li JT. Identification of SRSF2 as a potential immunodiagnostic biomarker for osteosarcoma: A study based on focused protein microarray. World J Clin Oncol 2026; 17(5): 119275
- URL: https://www.wjgnet.com/2218-4333/full/v17/i5/119275.htm
- DOI: https://dx.doi.org/10.5306/wjco.v17.i5.119275