
















Copyright: ©Author(s) 2026.
World J Clin Oncol. May 24, 2026; 17(5): 116662
Published online May 24, 2026. doi: 10.5306/wjco.v17.i5.116662
Published online May 24, 2026. doi: 10.5306/wjco.v17.i5.116662
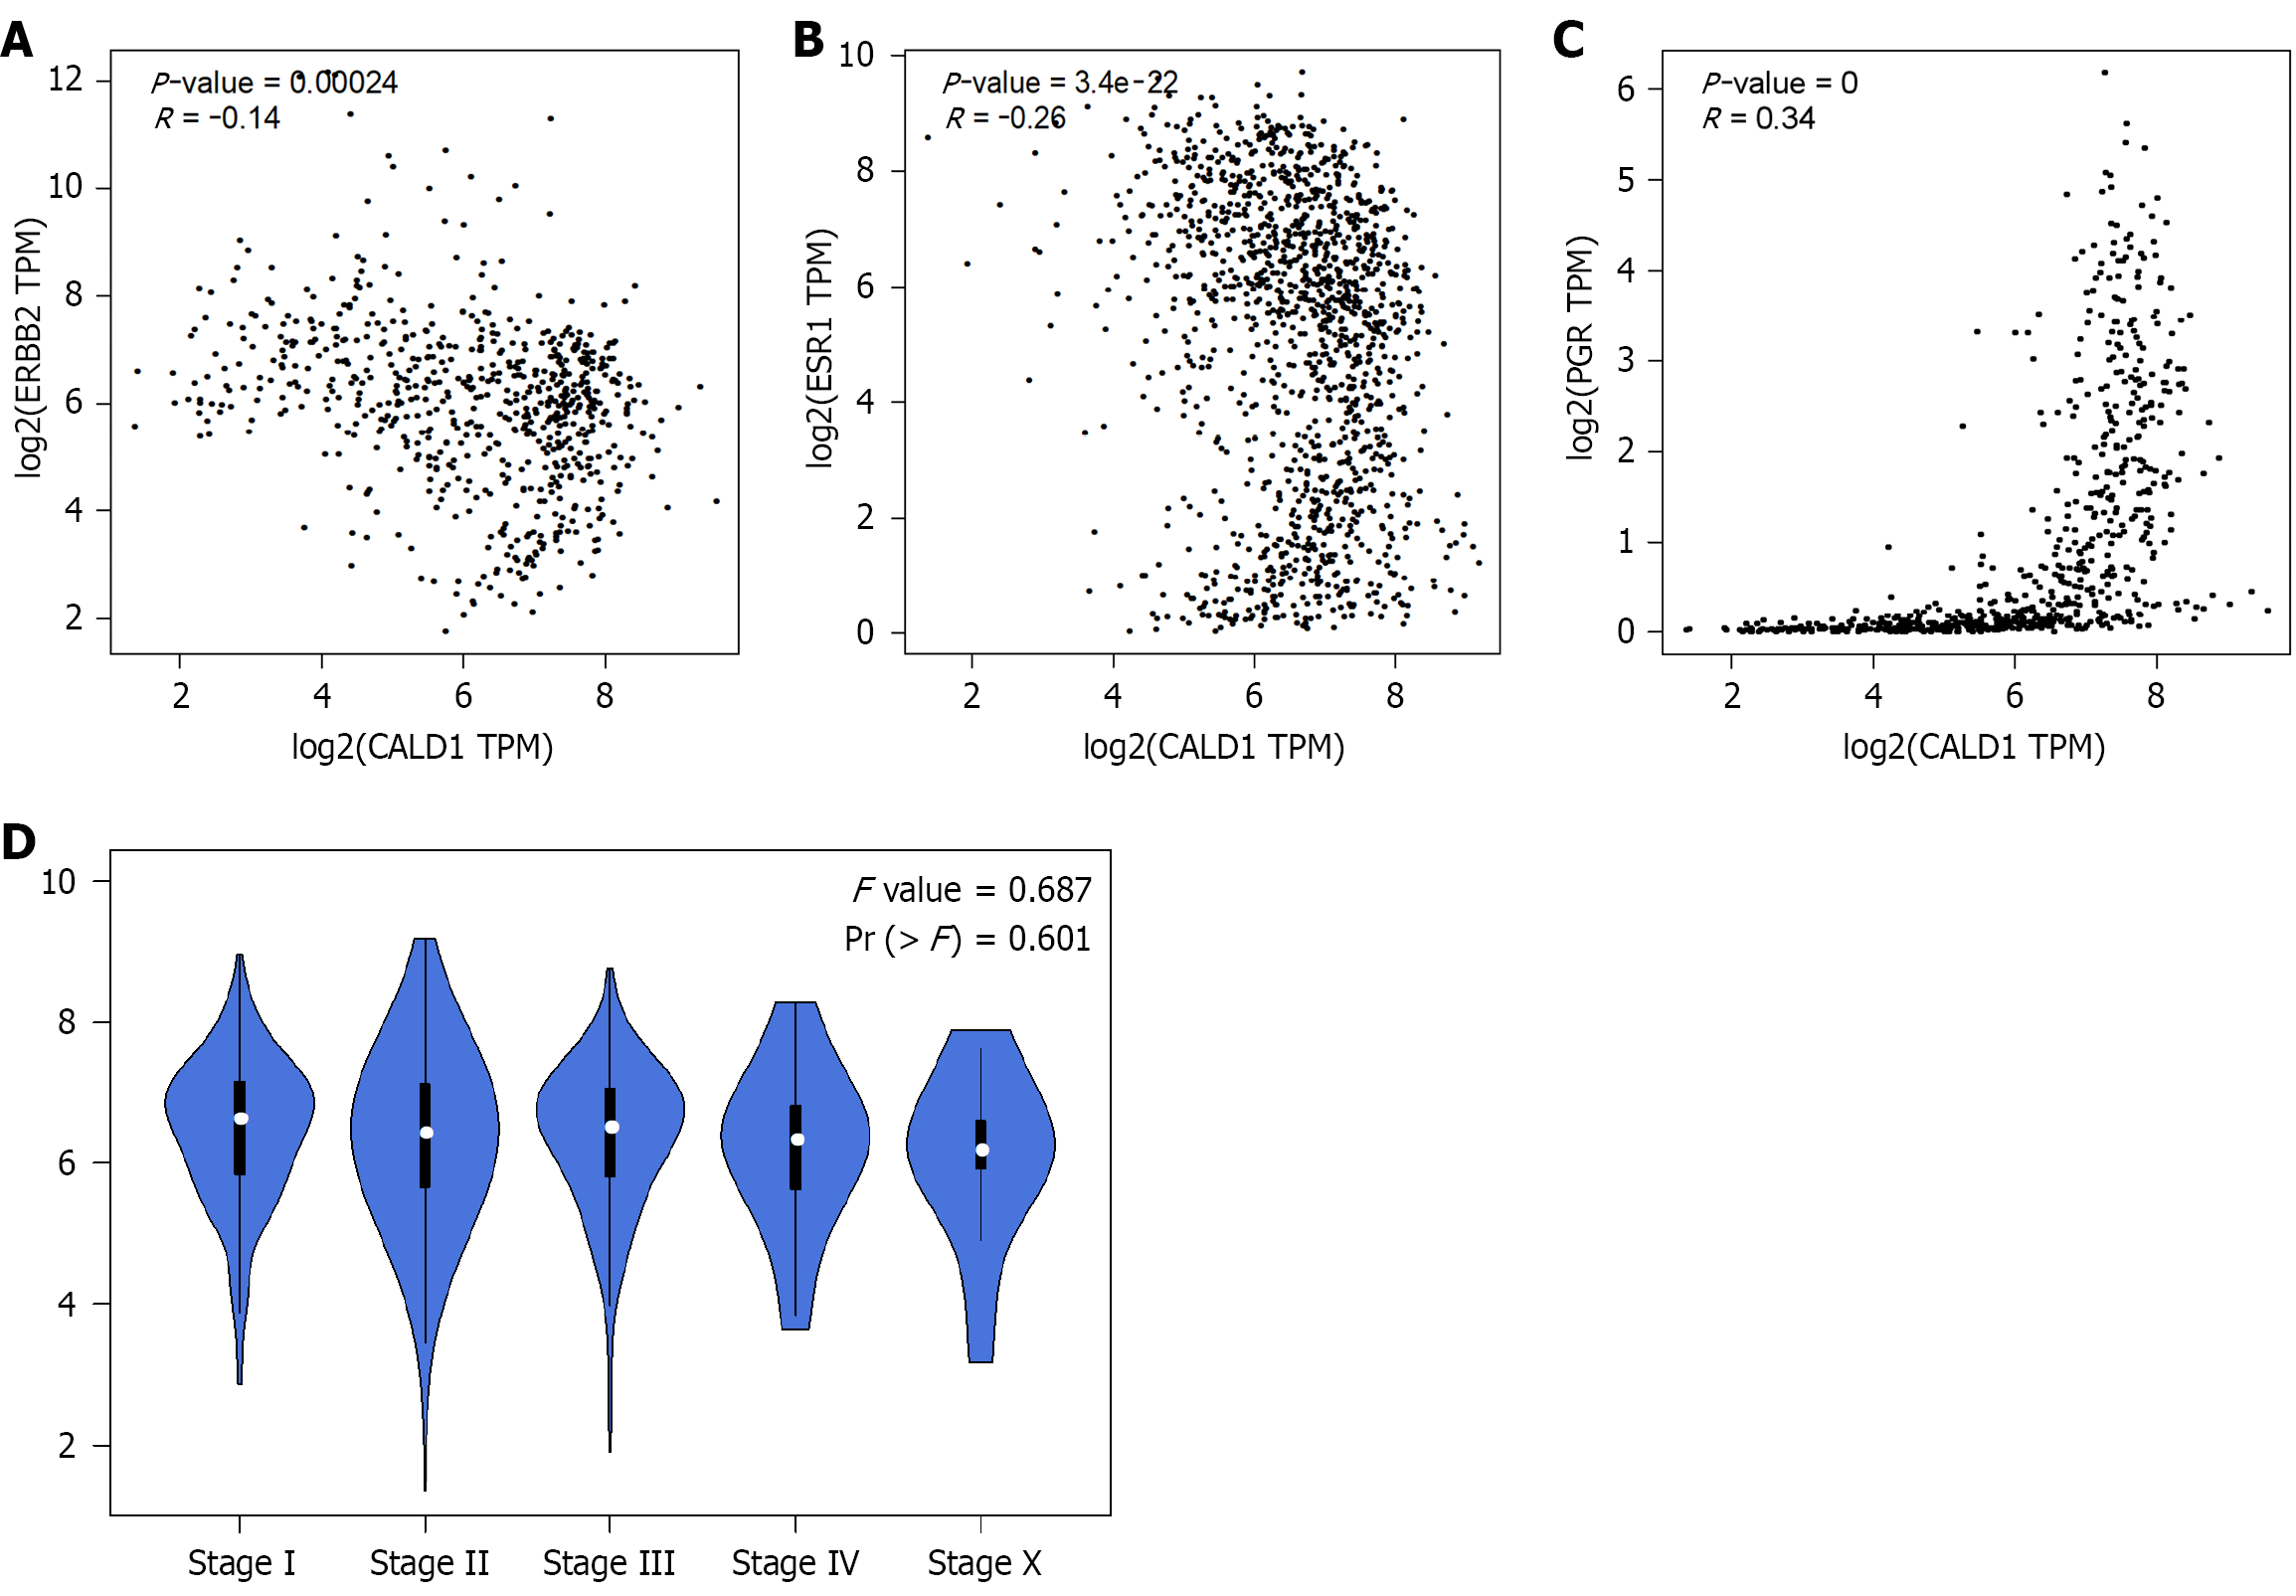
Figure 9 Correlation between CALD1 expression and clinicopathological features of breast cancer in The Cancer Genome Atlas cohort.
Correlation analyses between CALD1 gene expression and clinical parameters were performed using The Cancer Genome Atlas breast cancer dataset via the Gene Expression Profiling Interactive Analysis platform (http://gepia.cancer-pku.cn; accessed on June 4, 2024). A: High degree of correlation between CALD1 and ERBB2/HER2 expression (P = 0.00024, R = -0.14); B: High degree of correlation between CALD1 and ESR1/E2 expression (P = 3.4 × 10⁻²², R = -0.26); C: High degree of correlation between CALD1 and PGR expression (P = 0, R = 0.34); D: Association between CALD1 and pathological stage in breast cancer. TPM: Transcript per million.
- Citation: AlNuaimi A, Nair VA, Al-Khayyal N, Suliman A, Bou Malhab LJ, Hamoudi R, Hamad M, Talaat IM, Abdel-Rahman WM. Overexpression of low-molecular-weight caldesmon is associated with aggressive phenotypes and epithelial-mesenchymal transition in breast cancer cells. World J Clin Oncol 2026; 17(5): 116662
- URL: https://www.wjgnet.com/2218-4333/full/v17/i5/116662.htm
- DOI: https://dx.doi.org/10.5306/wjco.v17.i5.116662