
















Copyright: ©Author(s) 2026.
World J Clin Oncol. May 24, 2026; 17(5): 116662
Published online May 24, 2026. doi: 10.5306/wjco.v17.i5.116662
Published online May 24, 2026. doi: 10.5306/wjco.v17.i5.116662
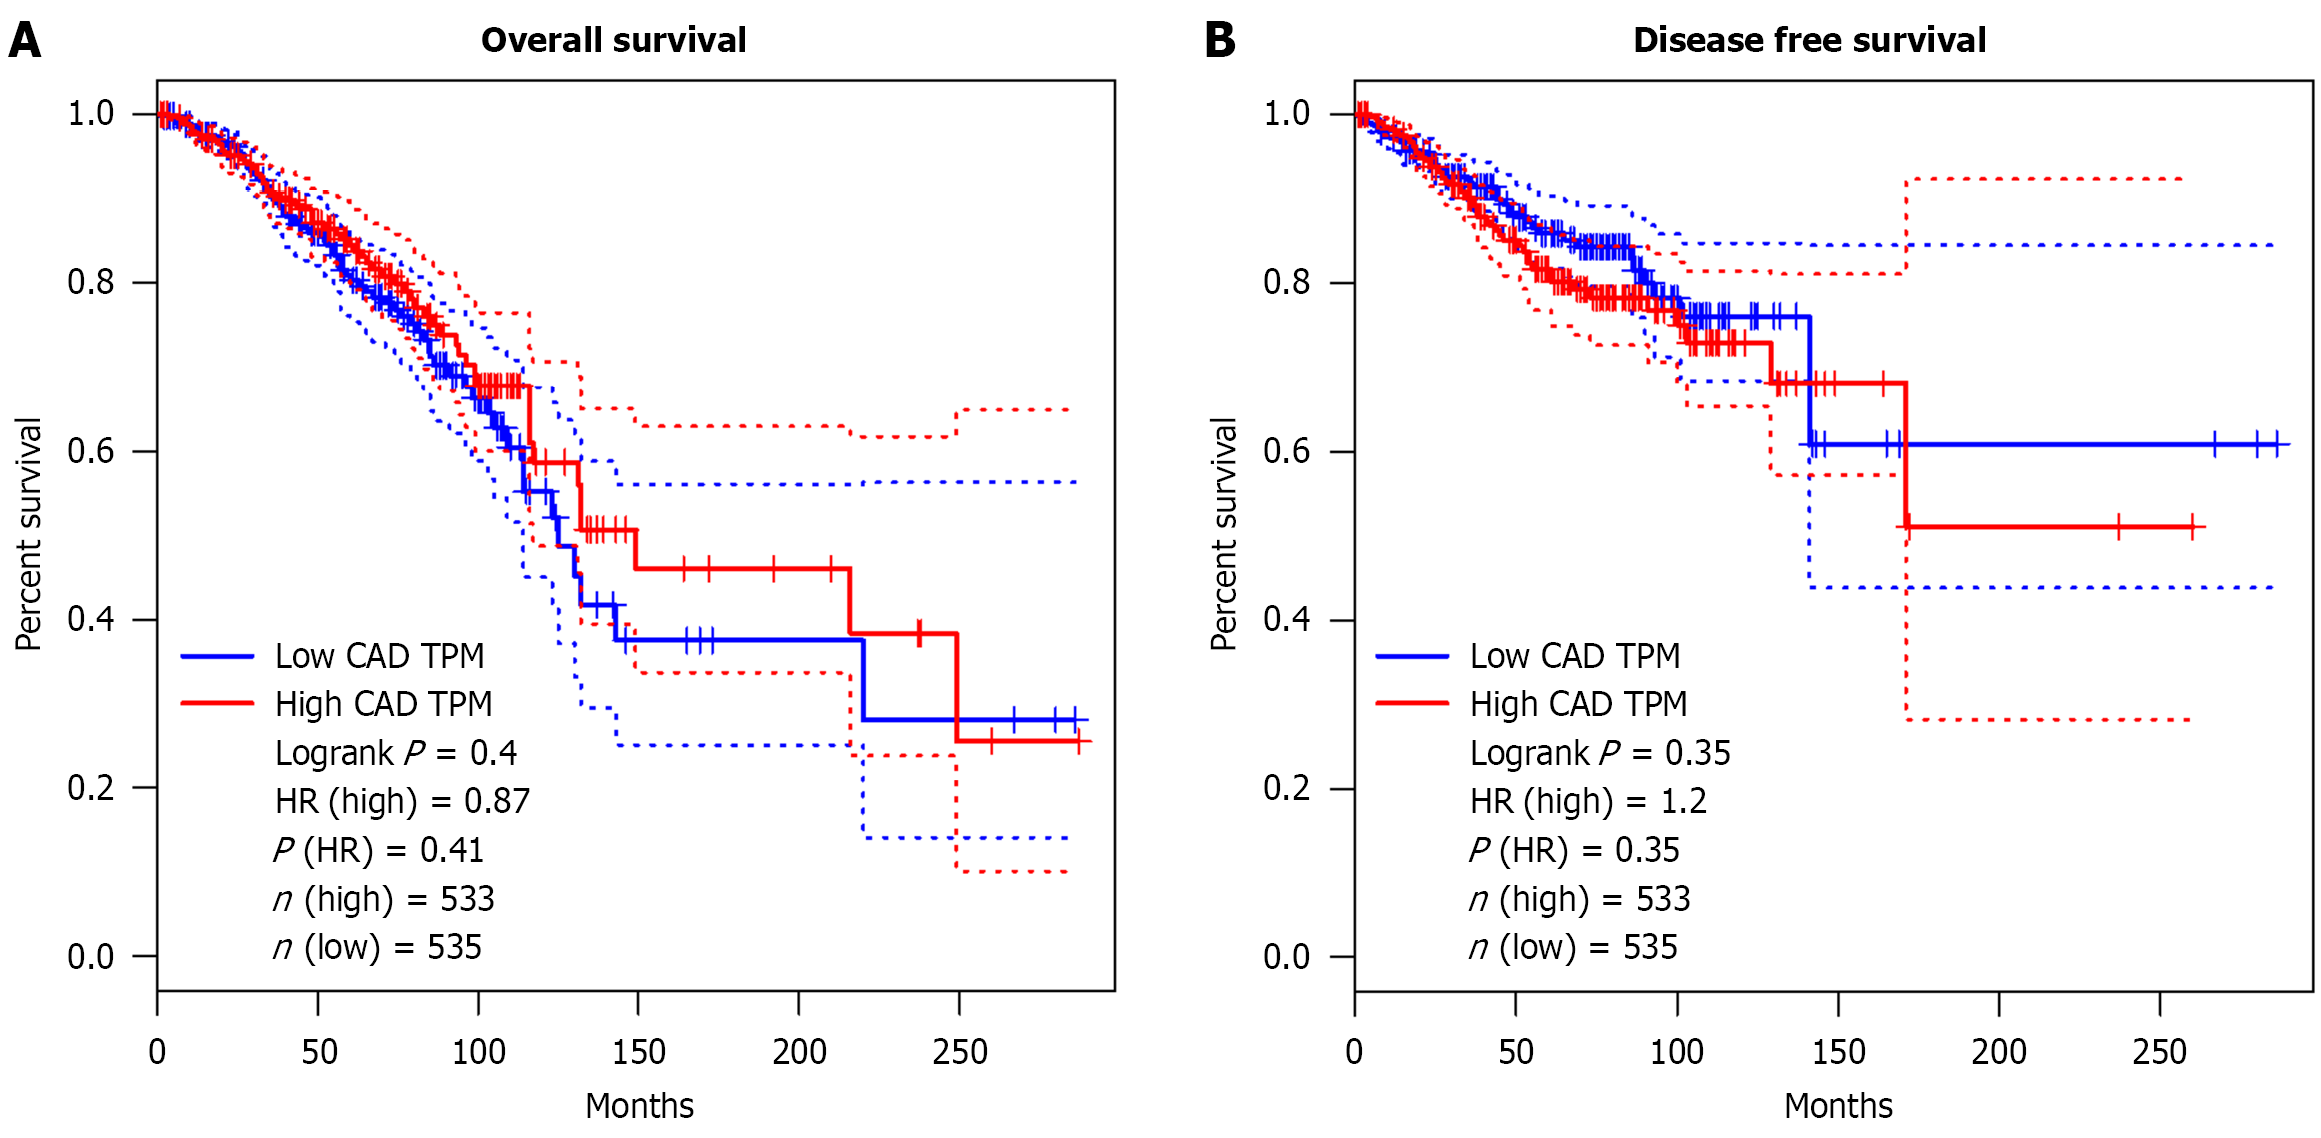
Figure 7 In silico analysis of CALD1 expression in breast cancer using The Cancer Genome Atlas dataset.
Analysis of CALD1 gene expression was performed using The Cancer Genome Atlas breast cancer cohort (n = 1070) via the Gene Expression Profiling Interactive Analysis platform at http://gepia.cancer-pku.cn/index.html (accessed on May 24, 2024). A: Kaplan-Meier survival curve shows the overall survival analysis of the cases of The Cancer Genome Atlas according to CALD1 gene expression status. The solid line represents the survival curve, and the dotted line represents the 69% confidence interval (hazard ratio = 0.94; P = 0.69, n = 1070); B: Disease-free survival analysis according to CALD1 expression status. Solid lines represent disease-free survival, and dotted lines represent the 95% confidence interval (hazard ratio = 0.97; P = 0.85, n = 1070). Median expression was used as the cutoff for group stratification. HR: Hazard ratio; TPM: Transcript per million; CAD: Caldesmon.
- Citation: AlNuaimi A, Nair VA, Al-Khayyal N, Suliman A, Bou Malhab LJ, Hamoudi R, Hamad M, Talaat IM, Abdel-Rahman WM. Overexpression of low-molecular-weight caldesmon is associated with aggressive phenotypes and epithelial-mesenchymal transition in breast cancer cells. World J Clin Oncol 2026; 17(5): 116662
- URL: https://www.wjgnet.com/2218-4333/full/v17/i5/116662.htm
- DOI: https://dx.doi.org/10.5306/wjco.v17.i5.116662