
















Copyright: ©Author(s) 2026.
World J Clin Oncol. Apr 24, 2026; 17(4): 116601
Published online Apr 24, 2026. doi: 10.5306/wjco.v17.i4.116601
Published online Apr 24, 2026. doi: 10.5306/wjco.v17.i4.116601
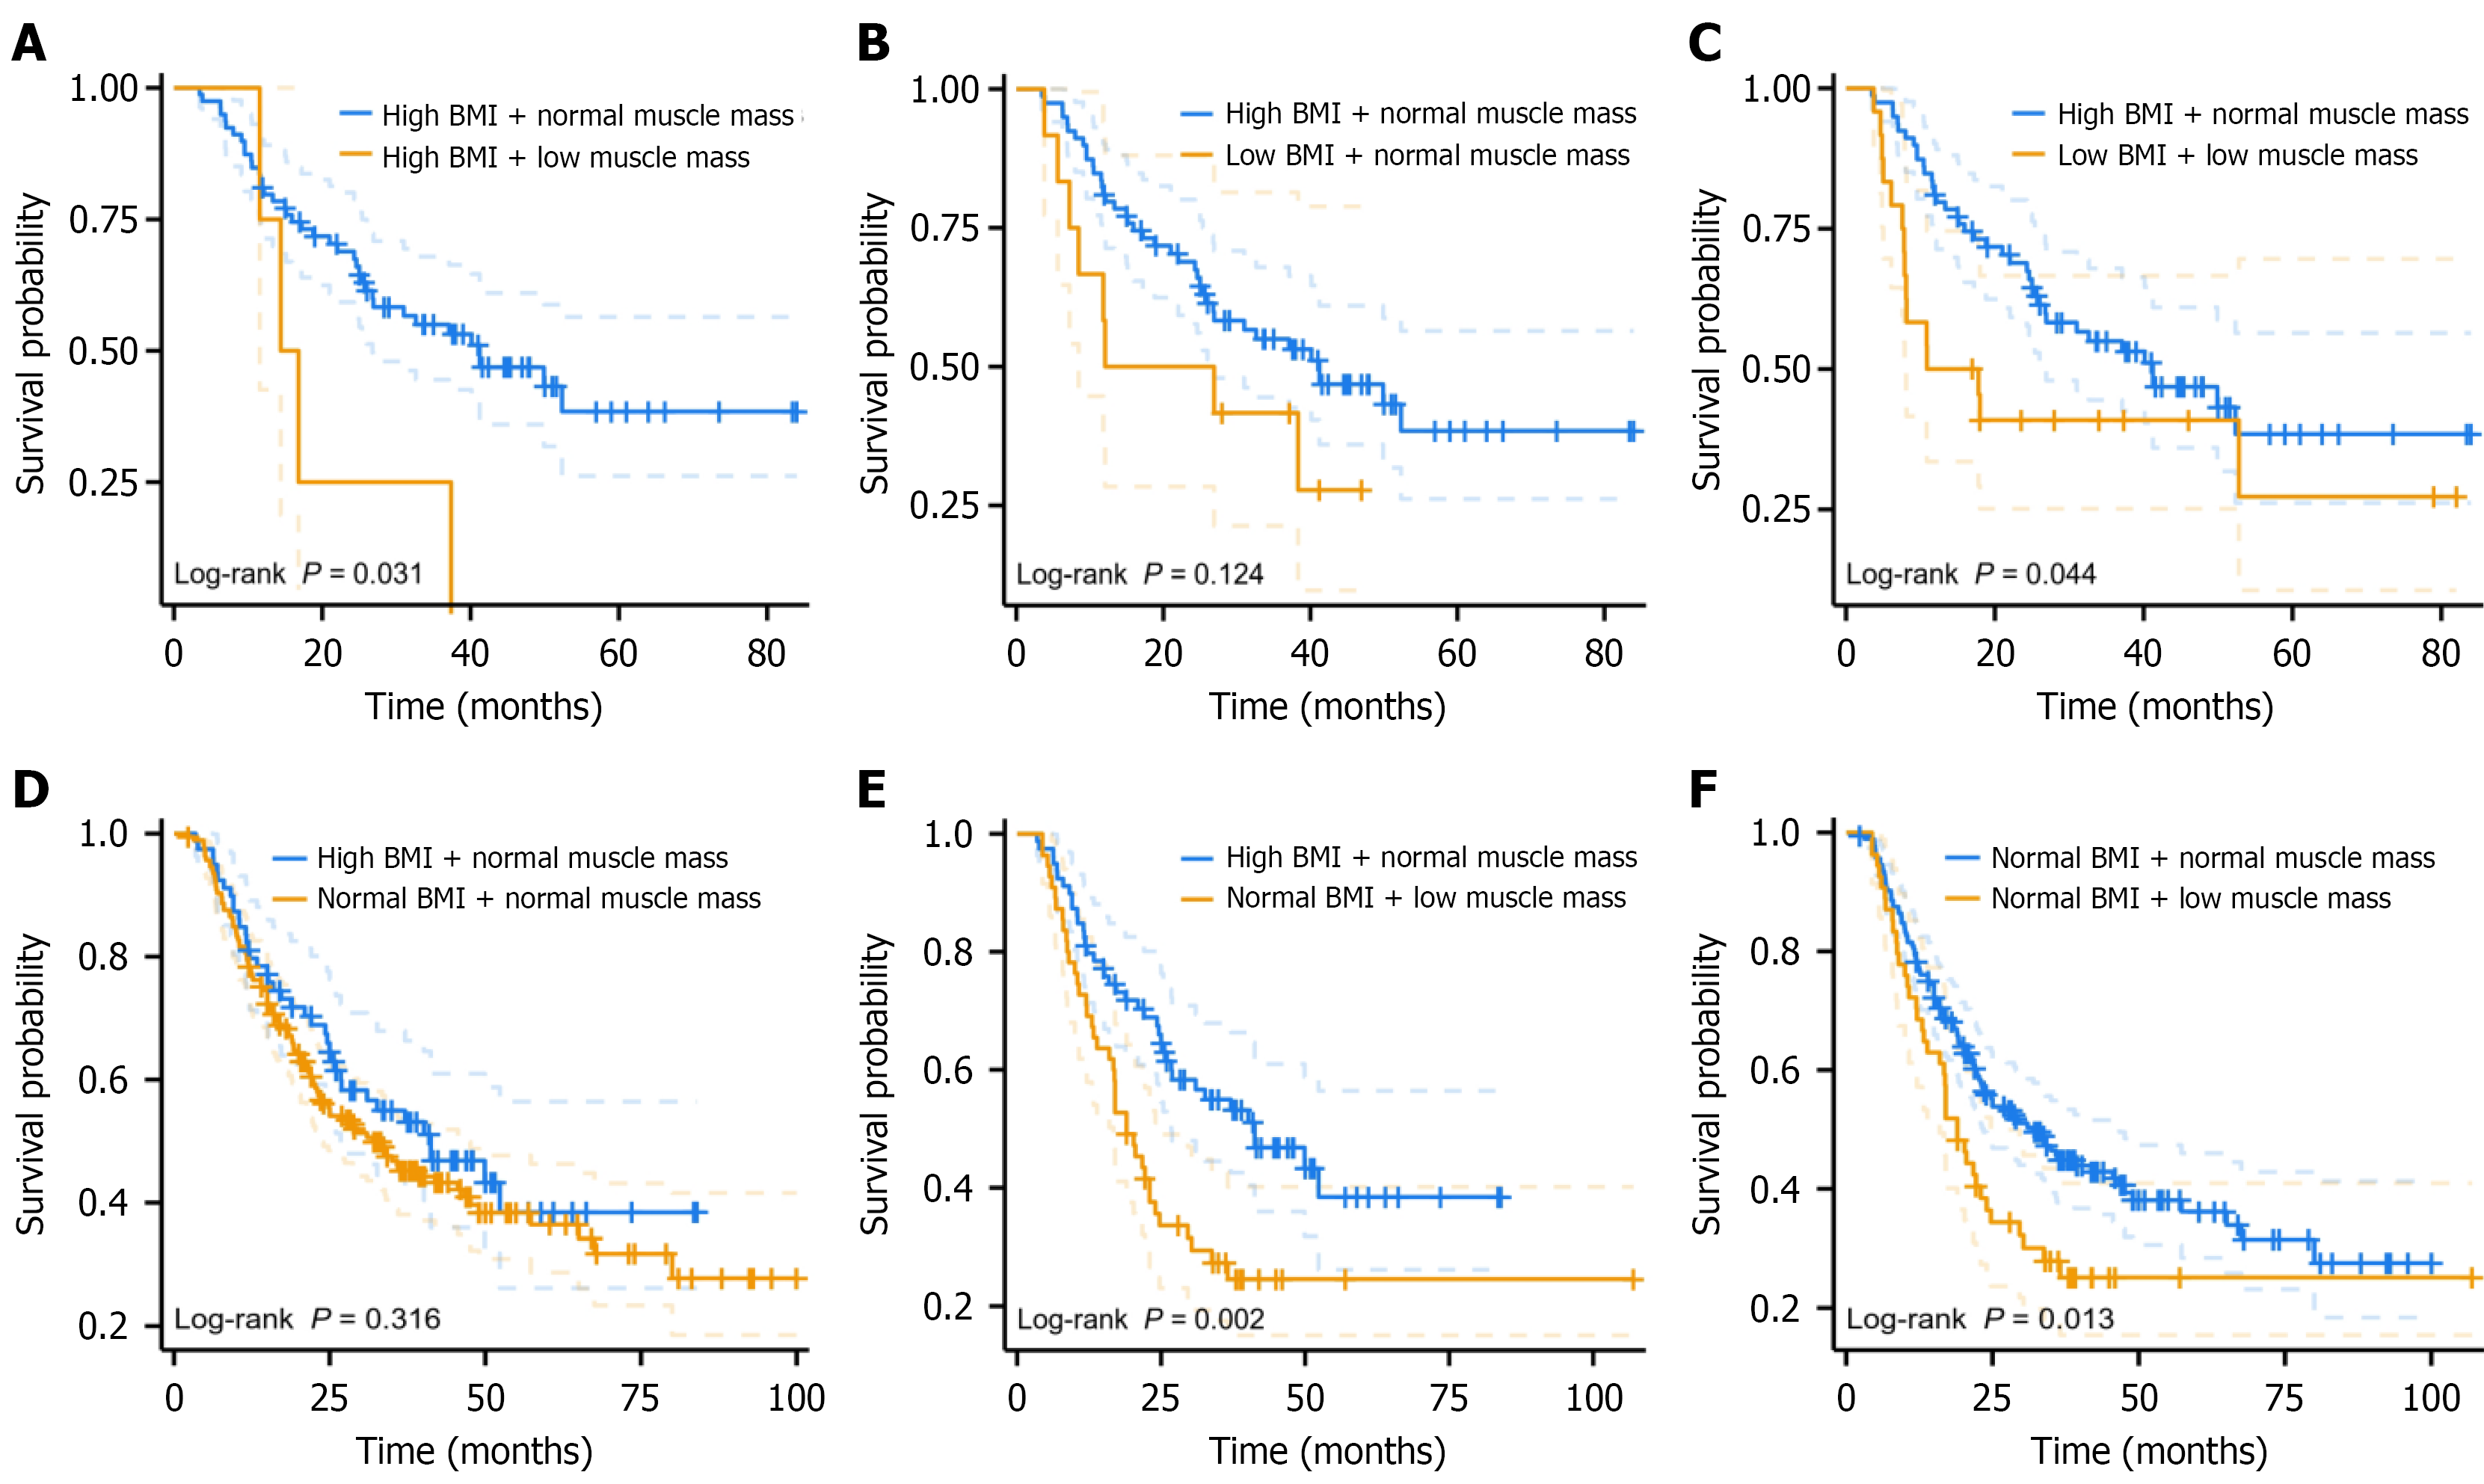
Figure 2 Survival analysis by combined body mass index and muscle mass status.
Patients were stratified by body mass index (BMI) (low: < 18.5 kg/m2; normal: 18.5-24 kg/m2; high: ≥ 24 kg/m2) and muscle mass status [normal muscle mass or low muscle mass (LMM)]. Panels A-E use high BMI and normal muscle mass as the reference group (blue curves). A: High BMI and LMM; B: Low BMI and normal muscle mass; C: Low BMI and LMM; D: Normal BMI and normal muscle mass; E: Normal BMI and LMM; F: Uses normal BMI and normal muscle mass as the reference group (blue curve). BMI: Body mass index.
- Citation: Xiao L, Liu YD, Zhang X, Zhang SC, Lyu JH. Body mass index predicts low muscle mass in esophageal squamous cell carcinoma patients undergoing chemoradiotherapy. World J Clin Oncol 2026; 17(4): 116601
- URL: https://www.wjgnet.com/2218-4333/full/v17/i4/116601.htm
- DOI: https://dx.doi.org/10.5306/wjco.v17.i4.116601