
















Copyright: ©Author(s) 2026.
World J Clin Oncol. Apr 24, 2026; 17(4): 115851
Published online Apr 24, 2026. doi: 10.5306/wjco.v17.i4.115851
Published online Apr 24, 2026. doi: 10.5306/wjco.v17.i4.115851
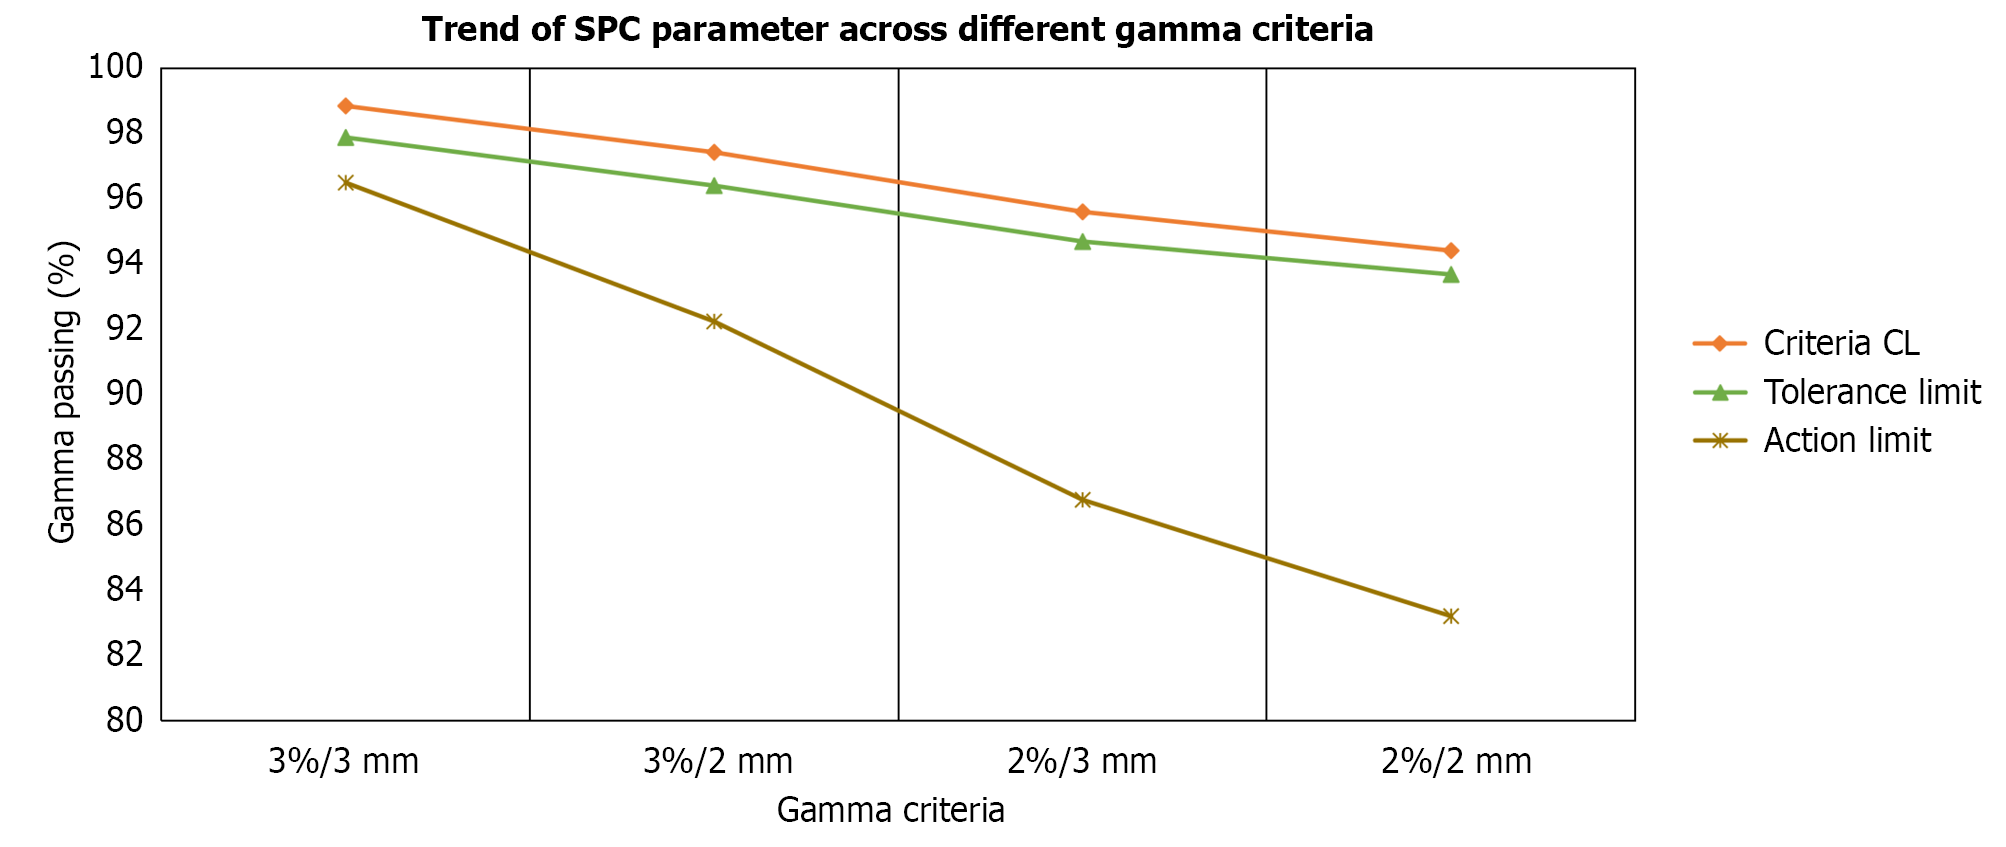
Figure 5 Schematic summary figure showing how the statistical process control parameters (control limits, tolerance limits, and action limits) progressively decline across stricter gamma criteria (3%/3 mm → 2%/2 mm).
SPC: Statistical process control; CL: Control limits.
- Citation: Singh P, Singh MK, Mishra A. Use of statistical process control to study the patient-specific quality assurance in head and neck cancer. World J Clin Oncol 2026; 17(4): 115851
- URL: https://www.wjgnet.com/2218-4333/full/v17/i4/115851.htm
- DOI: https://dx.doi.org/10.5306/wjco.v17.i4.115851