
















Copyright: ©Author(s) 2026.
World J Clin Oncol. Apr 24, 2026; 17(4): 115287
Published online Apr 24, 2026. doi: 10.5306/wjco.v17.i4.115287
Published online Apr 24, 2026. doi: 10.5306/wjco.v17.i4.115287
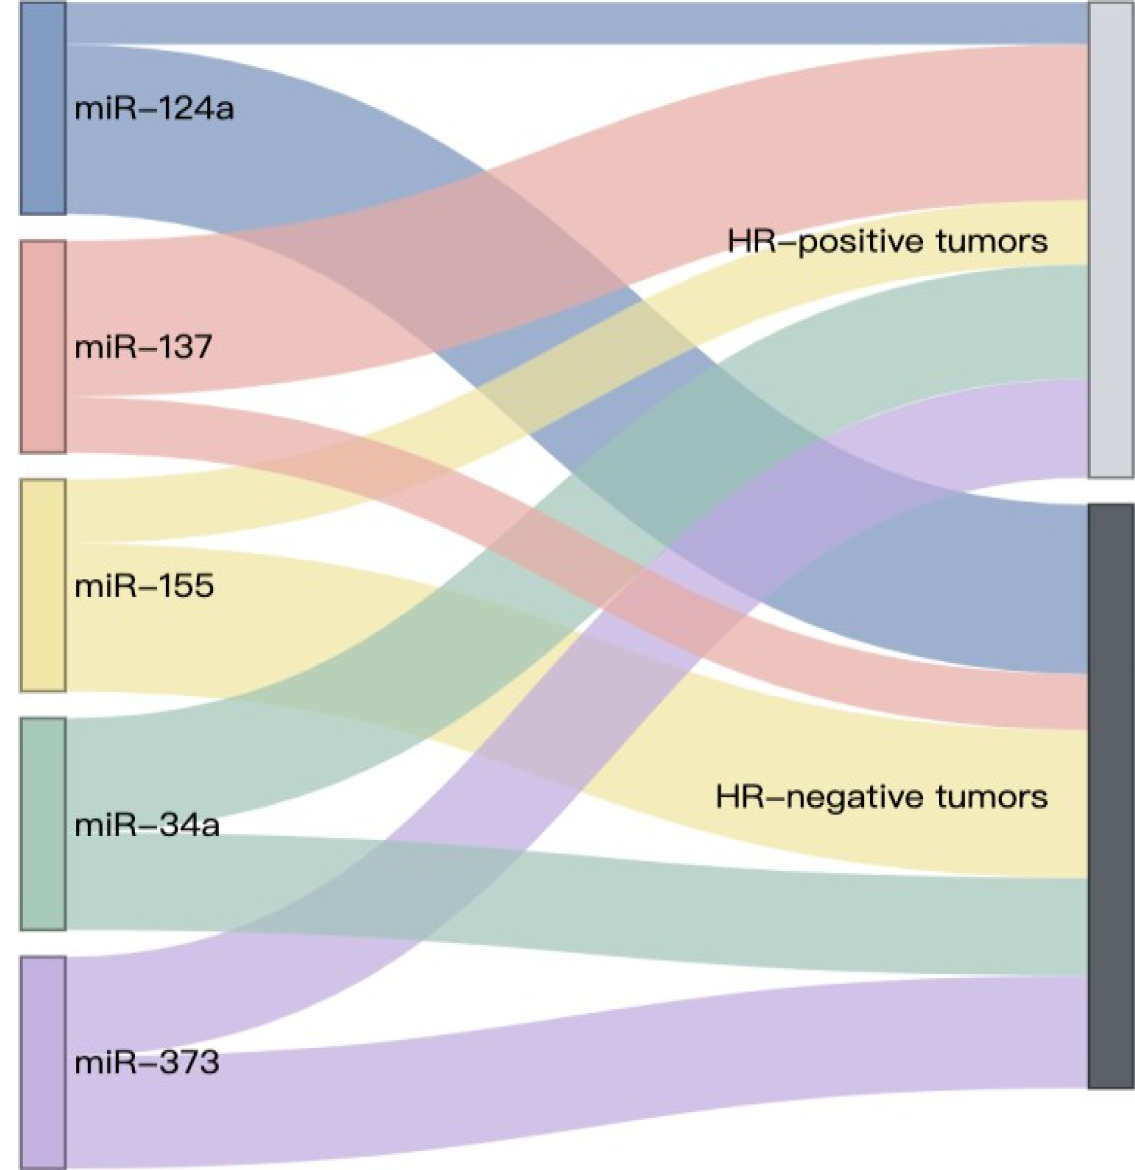
Figure 2 Visualization of microRNA distribution between hormone receptor-positive and hormone receptor-negative breast tumors using a Sankey diagram.
Sankey diagram illustrates the relative distribution of normalized expression levels for selected miRNAs across hormone receptor-positive and hormone receptor-negative breast cancer subtypes. Each microRNA’s expression was normalized independently to enable meaningful visual comparison. This normalization ensures that expression patterns are comparable across clinical subtypes, regardless of absolute expression differences. HR: Hormone receptor.
- Citation: Ryspayeva D, Seyhan AA, Mu K, Liu M, Purcell C, MacDonald WJ, Halytskiy V, Drevytska T, Inomistova M, Khranovska N, Potorocha O, Taran L, Sumkina O, Smolanka Sr I, El-Deiry WS. Longitudinal microRNA profiles in breast cancer tissue and plasma: Associations with hormone receptors, response, and survival. World J Clin Oncol 2026; 17(4): 115287
- URL: https://www.wjgnet.com/2218-4333/full/v17/i4/115287.htm
- DOI: https://dx.doi.org/10.5306/wjco.v17.i4.115287