
















Copyright: ©Author(s) 2026.
World J Clin Oncol. Mar 24, 2026; 17(3): 117055
Published online Mar 24, 2026. doi: 10.5306/wjco.v17.i3.117055
Published online Mar 24, 2026. doi: 10.5306/wjco.v17.i3.117055
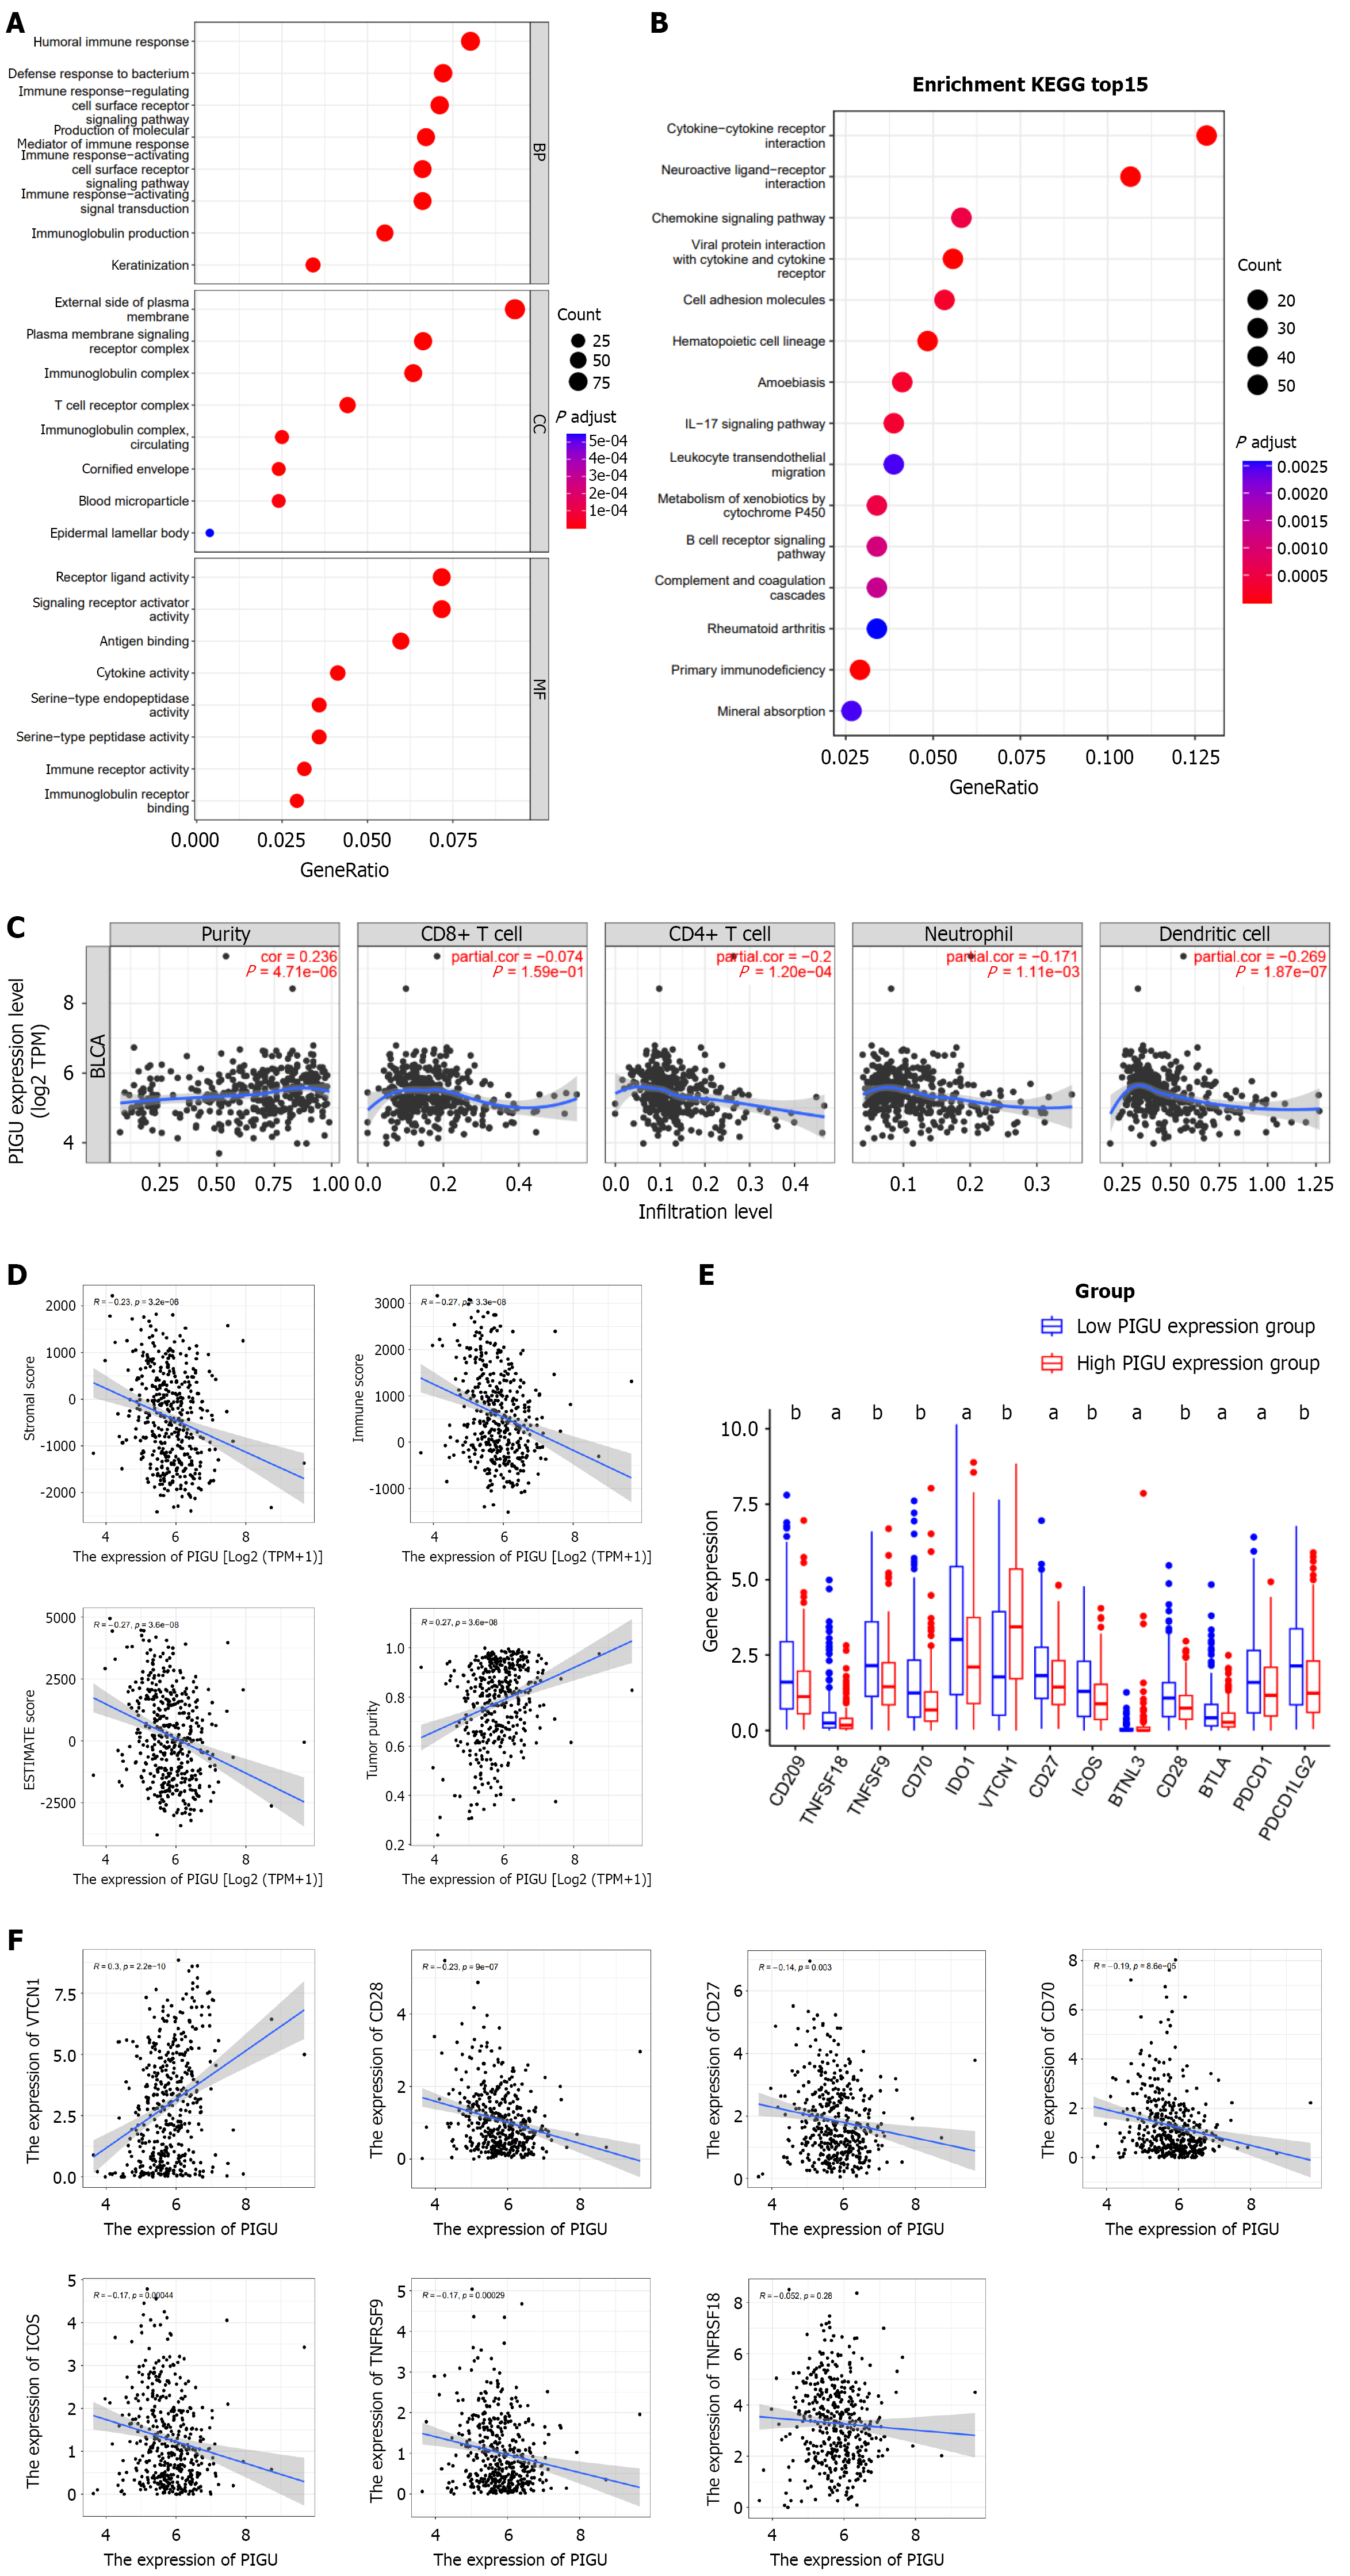
Figure 13 Relationship between PIGU expression and tumor immune infiltration.
A: Gene Ontology enrichment analysis of differentially expressed genes in high- and low-PIGU expression groups; B: Kyoto Encyclopedia of Genes and Genomes enrichment analysis; C: Correlation between PIGU expression and immune cell infiltration levels from the TIMER website; D: Correlation between PIGU expression and stromal score, immune score, ESTIMATE score, and tumor purity; E: Differential expression of 13 immune checkpoint genes in high- and low-PIGU expression groups; F: Correlation scatter plots of PIGU with VTCN1, CD28, CD27, CD70, ICOS, TNFRSF9, and TNFRSF18. aP < 0.01, bP < 0.001.
- Citation: Li SH, Liu ZS, Chen YJ, Li JD, Wei L, Chen YY, Zhang W, Huang ZG, Chen ZD, Chen G, Wei DM, Mo ZN, Deng LL. PIGU overexpression and regulation of cellular biological functions in bladder cancer. World J Clin Oncol 2026; 17(3): 117055
- URL: https://www.wjgnet.com/2218-4333/full/v17/i3/117055.htm
- DOI: https://dx.doi.org/10.5306/wjco.v17.i3.117055