
















Copyright: ©Author(s) 2026.
World J Clin Oncol. Mar 24, 2026; 17(3): 117055
Published online Mar 24, 2026. doi: 10.5306/wjco.v17.i3.117055
Published online Mar 24, 2026. doi: 10.5306/wjco.v17.i3.117055
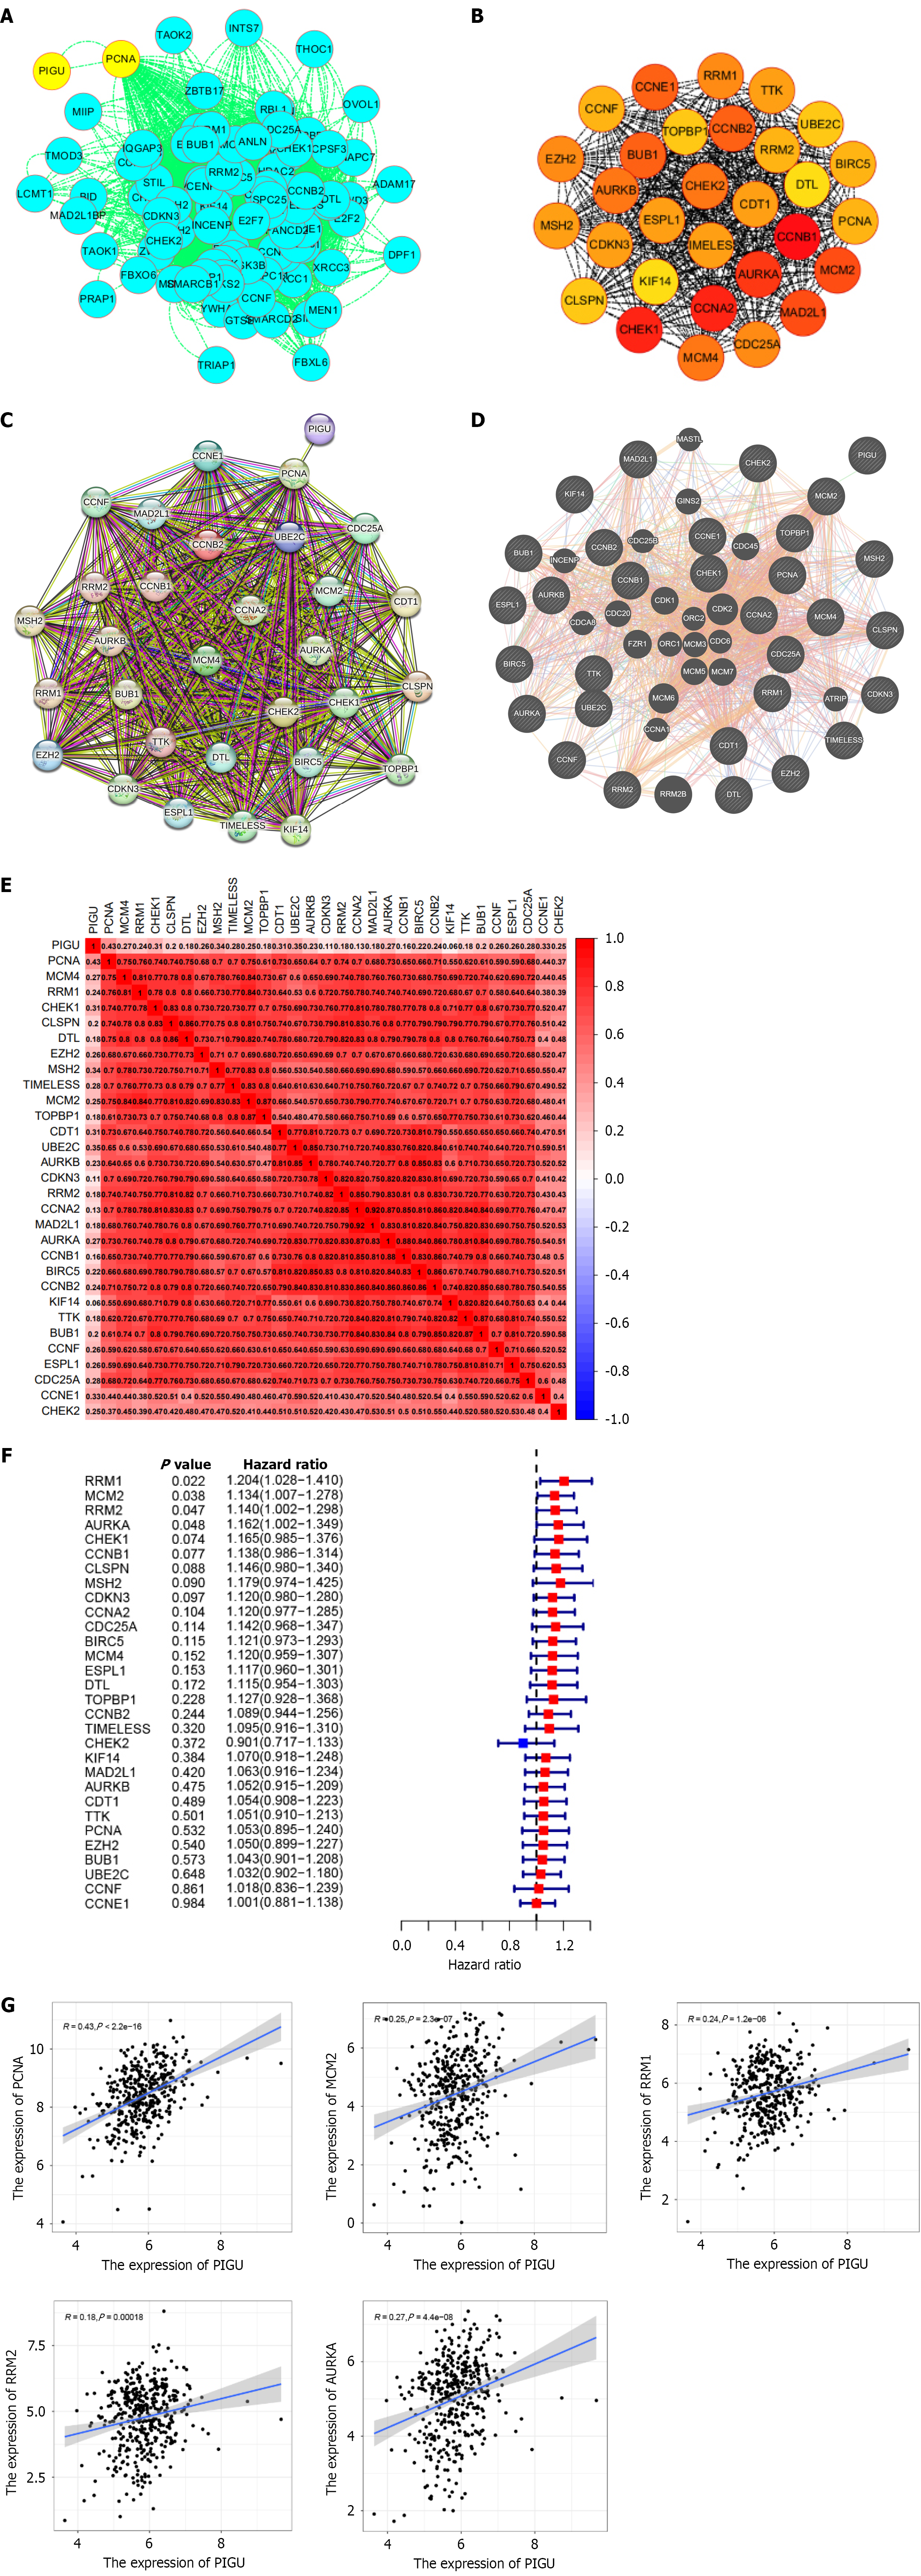
Figure 12 Identification of cell cycle-related hub genes.
A: Protein interaction results from the String database visualized in Cytoscape; B: Hub genes with the strongest protein interactions identified by the Cytoscape algorithm using the cytoHubba module; color shading indicates interaction strength; C and D: Protein-protein interaction network analysis (C: The String database; D: GeneMANIA database); E: Heatmap showing PIGU correlations with 30 hub genes; F: Forest plot of COX regression analysis for 30 hub genes; G: Scatterplot showing PIGU correlations with identified genes PCNA, MCM2, RRM1, RRM2, and AURKA.
- Citation: Li SH, Liu ZS, Chen YJ, Li JD, Wei L, Chen YY, Zhang W, Huang ZG, Chen ZD, Chen G, Wei DM, Mo ZN, Deng LL. PIGU overexpression and regulation of cellular biological functions in bladder cancer. World J Clin Oncol 2026; 17(3): 117055
- URL: https://www.wjgnet.com/2218-4333/full/v17/i3/117055.htm
- DOI: https://dx.doi.org/10.5306/wjco.v17.i3.117055