
















Copyright: ©Author(s) 2026.
World J Clin Oncol. Mar 24, 2026; 17(3): 117055
Published online Mar 24, 2026. doi: 10.5306/wjco.v17.i3.117055
Published online Mar 24, 2026. doi: 10.5306/wjco.v17.i3.117055
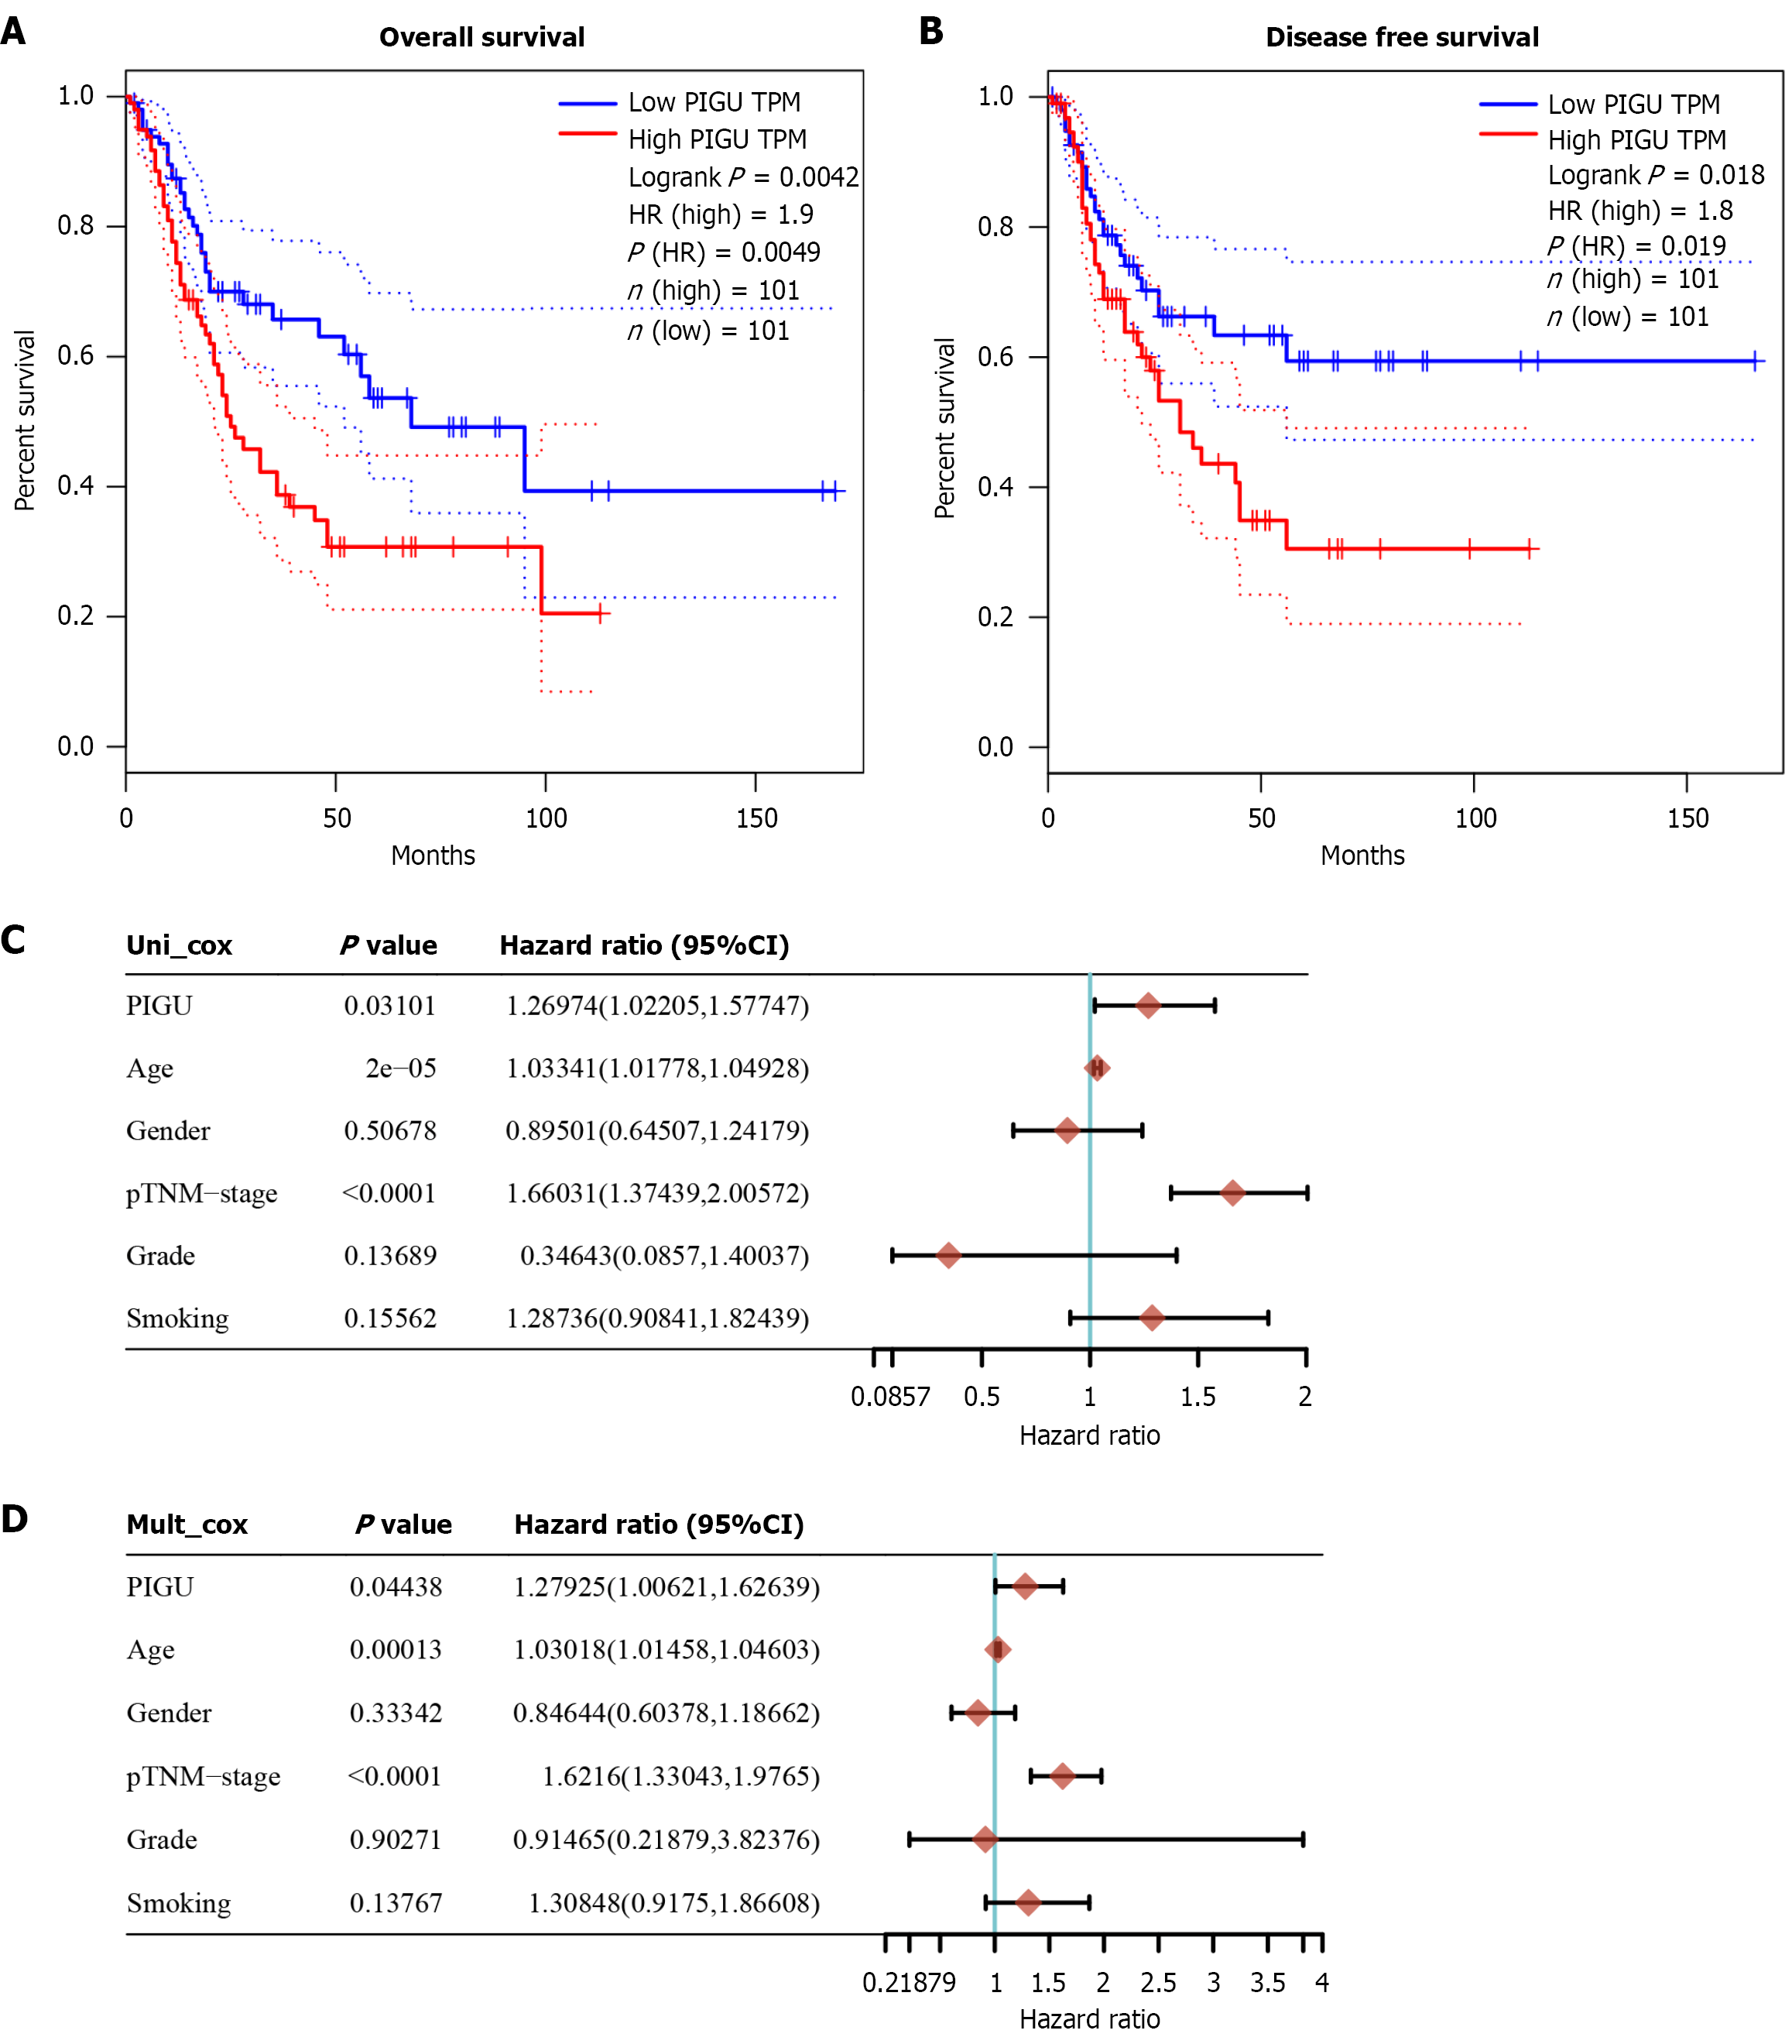
Figure 5 Prognostic value of PIGU mRNA expression levels in bladder cancer.
A and B: Kaplan-Meier curves for overall survival and disease-free survival in bladder cancer patients with high- and low-expression PIGU groups, where the bottom 25% represents the low-expression group and the top 25% represents the high-expression group; C: Forest plot of univariate Cox regression analysis; D: Forest plot of multivariate Cox regression analysis.
- Citation: Li SH, Liu ZS, Chen YJ, Li JD, Wei L, Chen YY, Zhang W, Huang ZG, Chen ZD, Chen G, Wei DM, Mo ZN, Deng LL. PIGU overexpression and regulation of cellular biological functions in bladder cancer. World J Clin Oncol 2026; 17(3): 117055
- URL: https://www.wjgnet.com/2218-4333/full/v17/i3/117055.htm
- DOI: https://dx.doi.org/10.5306/wjco.v17.i3.117055