
















Copyright: ©Author(s) 2026.
World J Clin Oncol. Mar 24, 2026; 17(3): 117055
Published online Mar 24, 2026. doi: 10.5306/wjco.v17.i3.117055
Published online Mar 24, 2026. doi: 10.5306/wjco.v17.i3.117055
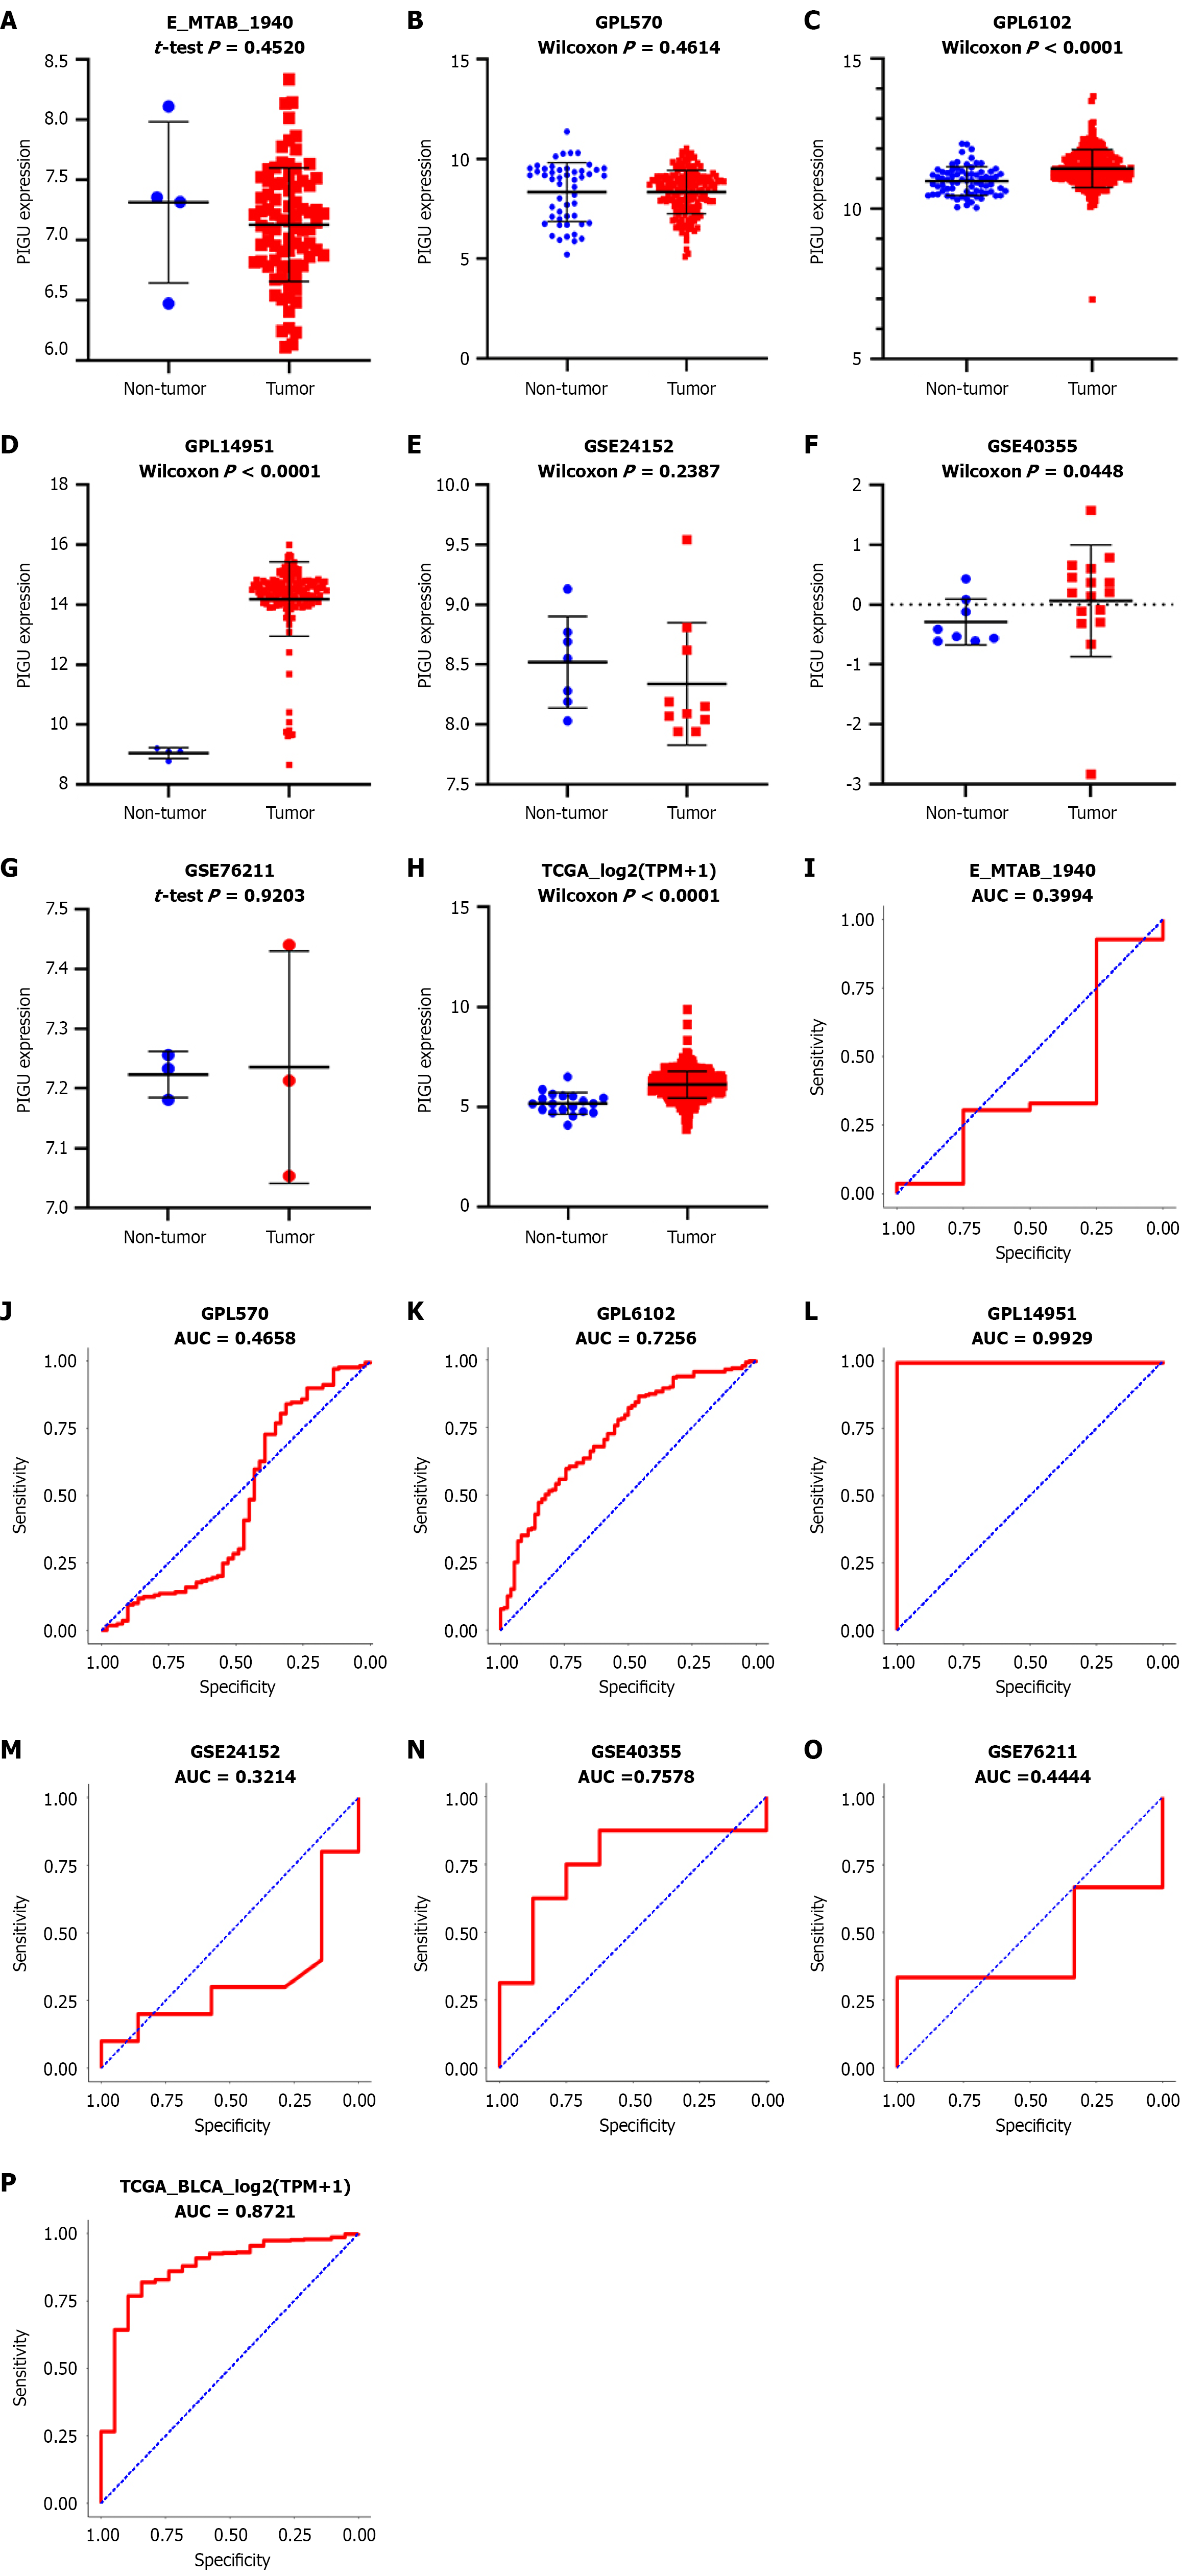
Figure 2 Analysis of all included microarray and RNA-seq datasets.
A-H: Scatter plots of PIGU expression across datasets; I-P: Receiver operating characteristic curves for PIGU in each dataset. AUC: Area under the curve.
- Citation: Li SH, Liu ZS, Chen YJ, Li JD, Wei L, Chen YY, Zhang W, Huang ZG, Chen ZD, Chen G, Wei DM, Mo ZN, Deng LL. PIGU overexpression and regulation of cellular biological functions in bladder cancer. World J Clin Oncol 2026; 17(3): 117055
- URL: https://www.wjgnet.com/2218-4333/full/v17/i3/117055.htm
- DOI: https://dx.doi.org/10.5306/wjco.v17.i3.117055