
















©The Author(s) 2026.
World J Clin Oncol. Feb 24, 2026; 17(2): 114622
Published online Feb 24, 2026. doi: 10.5306/wjco.v17.i2.114622
Published online Feb 24, 2026. doi: 10.5306/wjco.v17.i2.114622
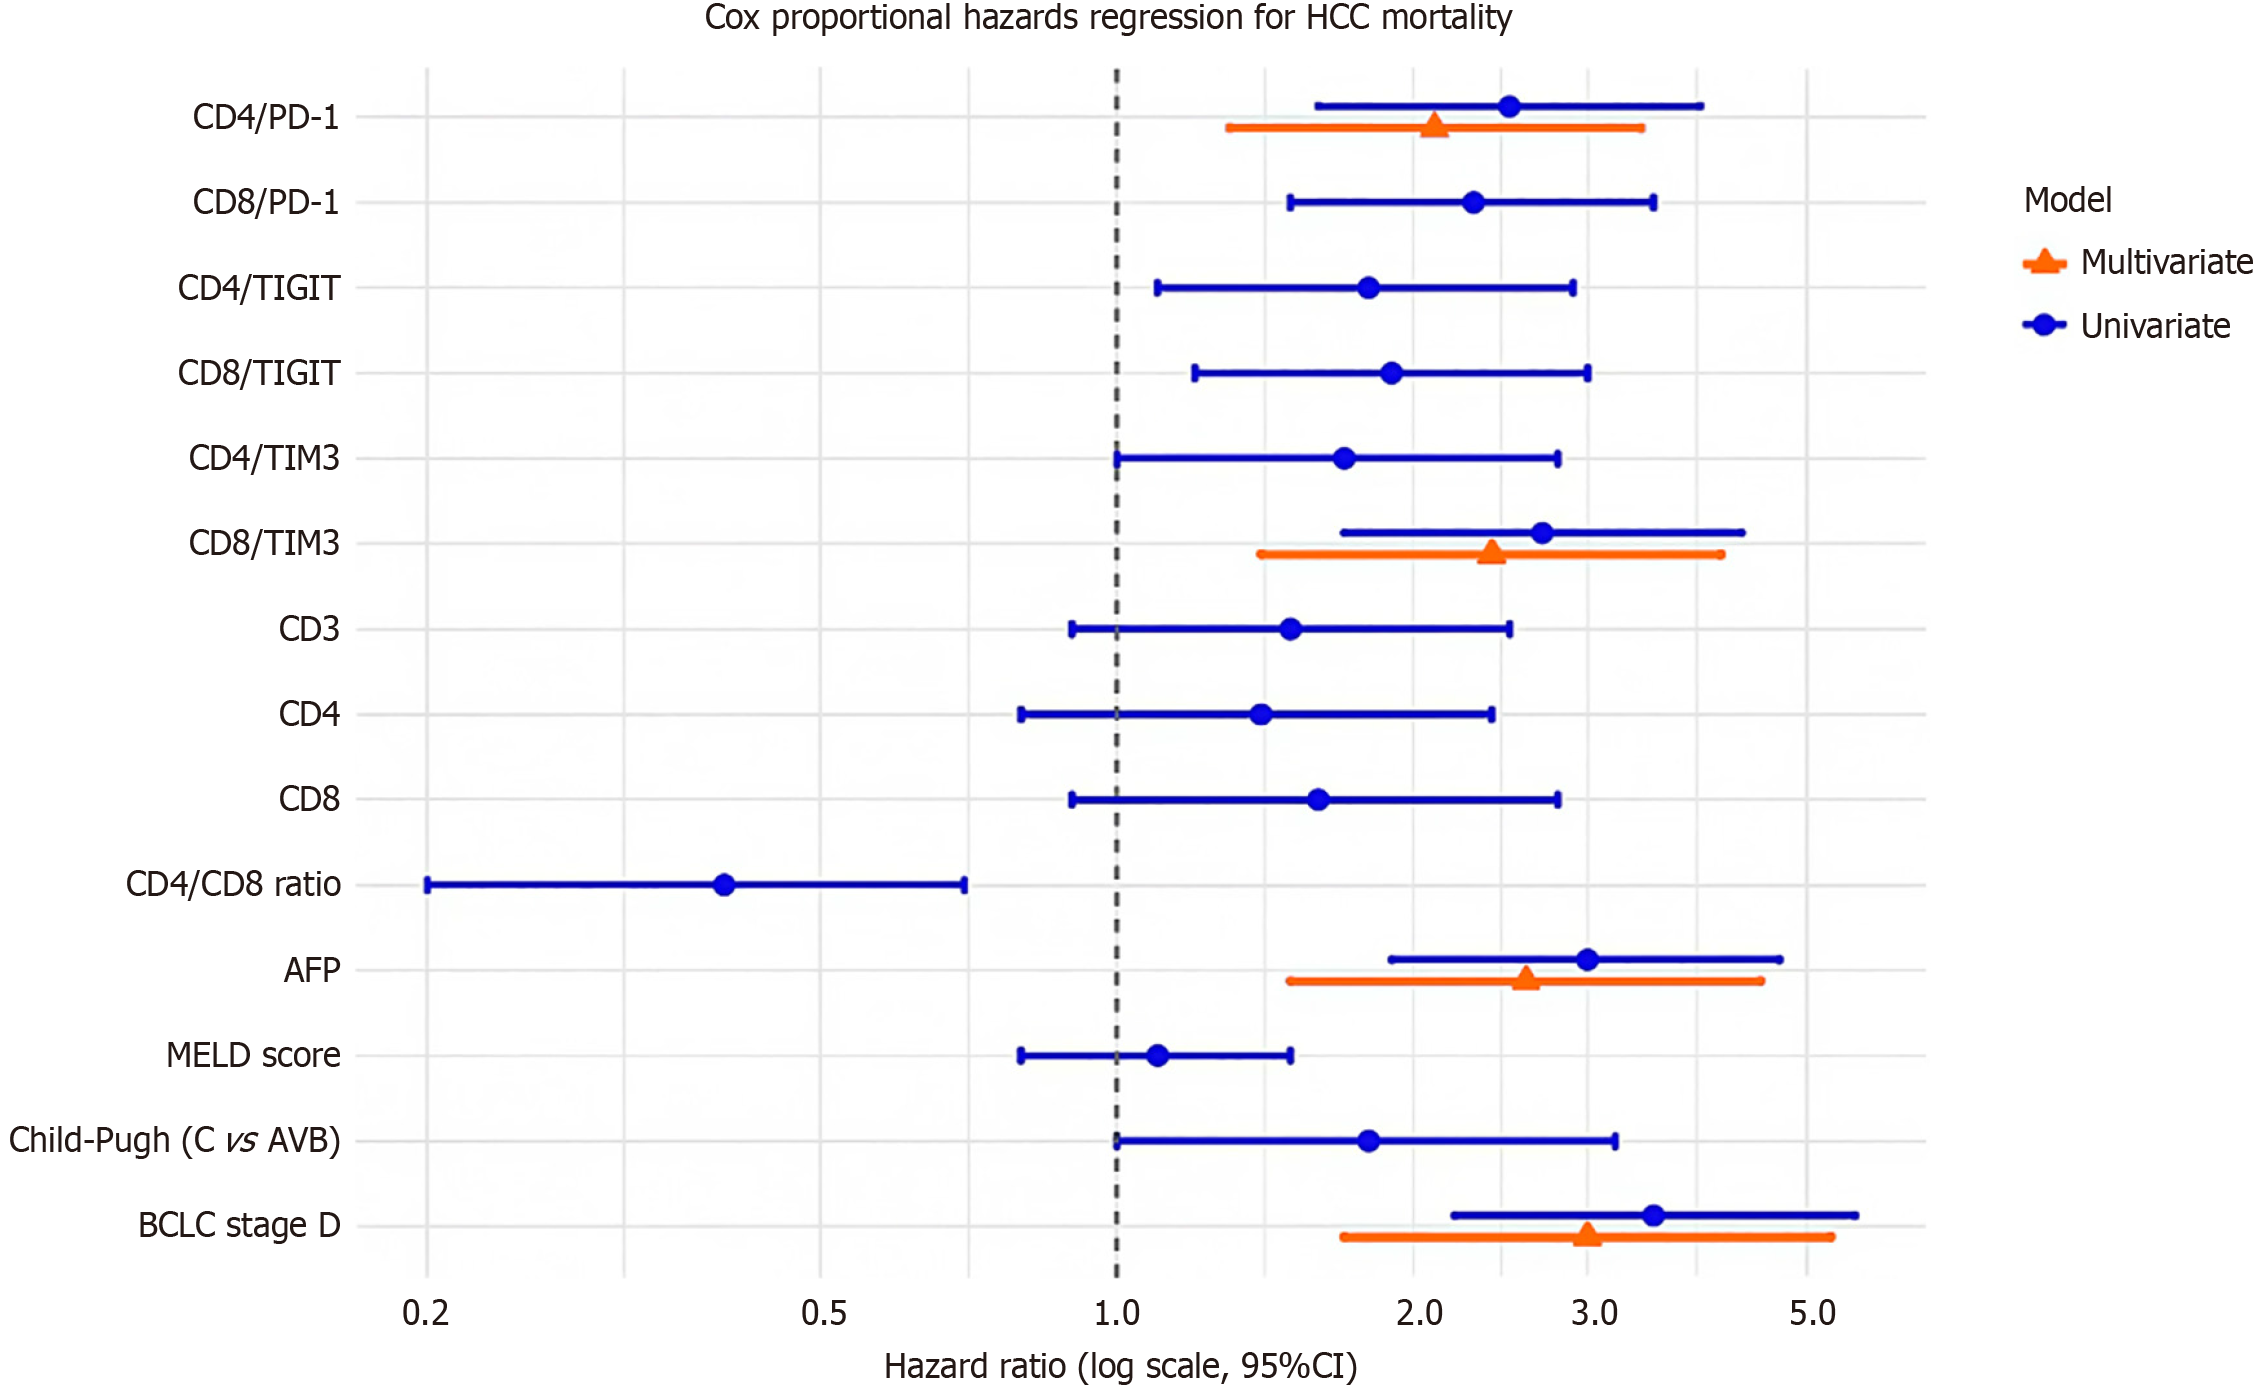
Figure 10 Forest plot of Cox proportional hazards regression for hepatocellular carcinoma mortality (n = 50).
Univariate (blue circles) and multivariate (orange triangles) hazard ratios [hazard ratios (HRs), 95% confidence interval (CI)] are shown for immune markers and clinical predictors. Significant independent predictors of mortality included CD4/programmed death 1 (HR = 2.1, 95%CI: 1.3-3.4, P = 0.002), CD8/T cell immunoglobulin and mucin domain-containing protein (HR = 2.4, 95%CI: 1.4-4.1, P = 0.001), alpha-fetoprotein (HR = 2.6, 95%CI: 1.5-4.5, P < 0.001), and Barcelona Clinic Liver Cancer stage D (HR = 3.0, 95%CI: 1.7-5.3, P < 0.001). Dashed vertical line denotes null effect (HR = 1). HCC: Hepatocellular carcinoma; PD-1: Programmed death 1; TIM3: T cell immunoglobulin and mucin domain-containing protein; TIGIT: T-cell immunoglobulin and ITIM domain; AFP: Alpha-fetoprotein; MELD: Model for End-Stage Liver Disease; BLCL: Barcelona Clinic Liver Cancer; CI: Confidence interval.
- Citation: Hasan AM, Ghanem SMFI, Othman AAA, Rashad MH, Nosair N, Elgamal R. T cell exhaustion markers in hepatitis C virus-related hepatocellular carcinoma: Expression patterns and prognostic significance in an Egyptian cohort. World J Clin Oncol 2026; 17(2): 114622
- URL: https://www.wjgnet.com/2218-4333/full/v17/i2/114622.htm
- DOI: https://dx.doi.org/10.5306/wjco.v17.i2.114622