
















©The Author(s) 2026.
World J Clin Oncol. Feb 24, 2026; 17(2): 113428
Published online Feb 24, 2026. doi: 10.5306/wjco.v17.i2.113428
Published online Feb 24, 2026. doi: 10.5306/wjco.v17.i2.113428
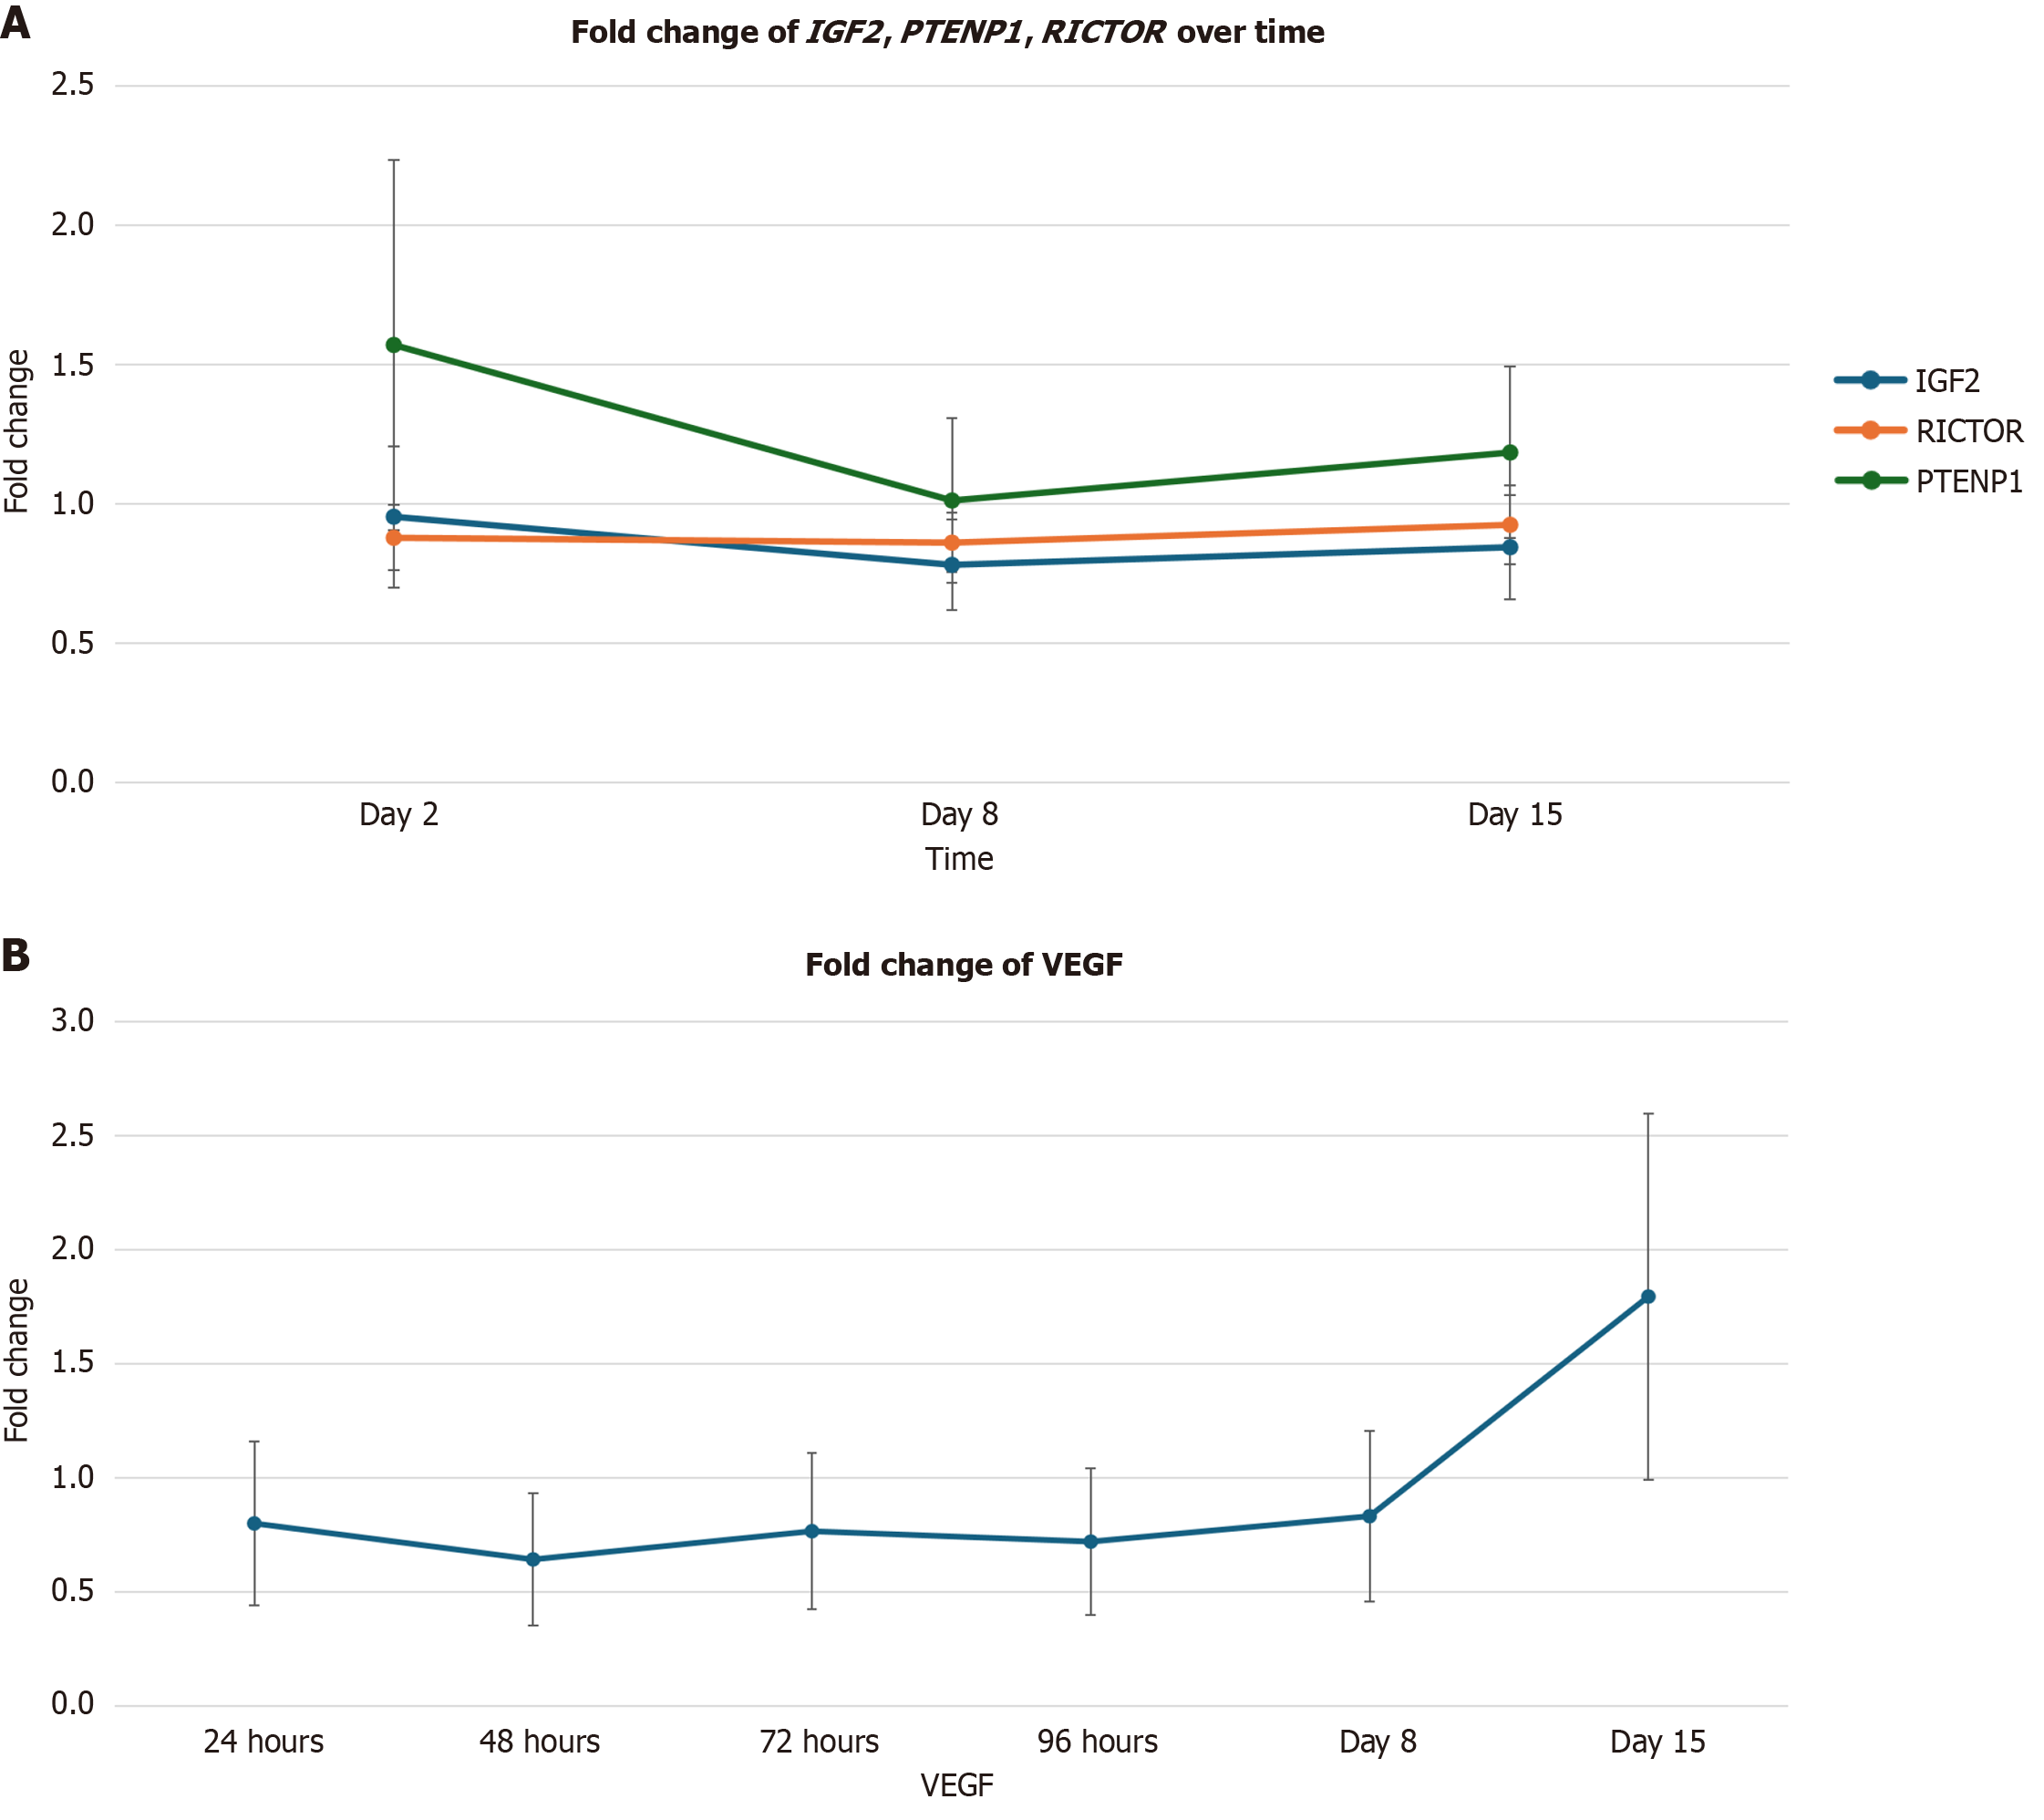
Figure 2 Alterations of IGF2, PTENP1, and RICTOR expression are correlated with reductions in vascular endothelial growth factor expression.
A: The relative change in IGF2, PTENP1, and RICTOR over time. Statistically significant reductions were observed for IGF2 expression on day 2 (P = 0.02); and days 2 (P = 0.04) and 8 (0.86-fold change; P = 0.04) for RICTOR. A statistically significant increase was observed for PTENP1 on day 2 (P = 0.02). Error bars represent one standard error of the mean of the data; B: The relative change in vascular endothelial growth factor expression (by mean expression across all reovirus-treated patients) over time. Statistically significant decreases were observed for vascular endothelial growth factor at 24 hours (P = 0.0003), day 2 (P = 0.007), and day 3 (P = 0.002). Error bars represent one standard error of the mean of the data.
- Citation: Zweig V, Goel S, Maitra R. Gene and cytokine expression profiles of metastatic colorectal cancer patients post reovirus administration. World J Clin Oncol 2026; 17(2): 113428
- URL: https://www.wjgnet.com/2218-4333/full/v17/i2/113428.htm
- DOI: https://dx.doi.org/10.5306/wjco.v17.i2.113428