
















Copyright: ©Author(s) 2026.
World J Clin Oncol. Oct 24, 2026; 17(10): 126647
Published online Oct 24, 2026. doi: 10.5306/wjco.126647
Published online Oct 24, 2026. doi: 10.5306/wjco.126647
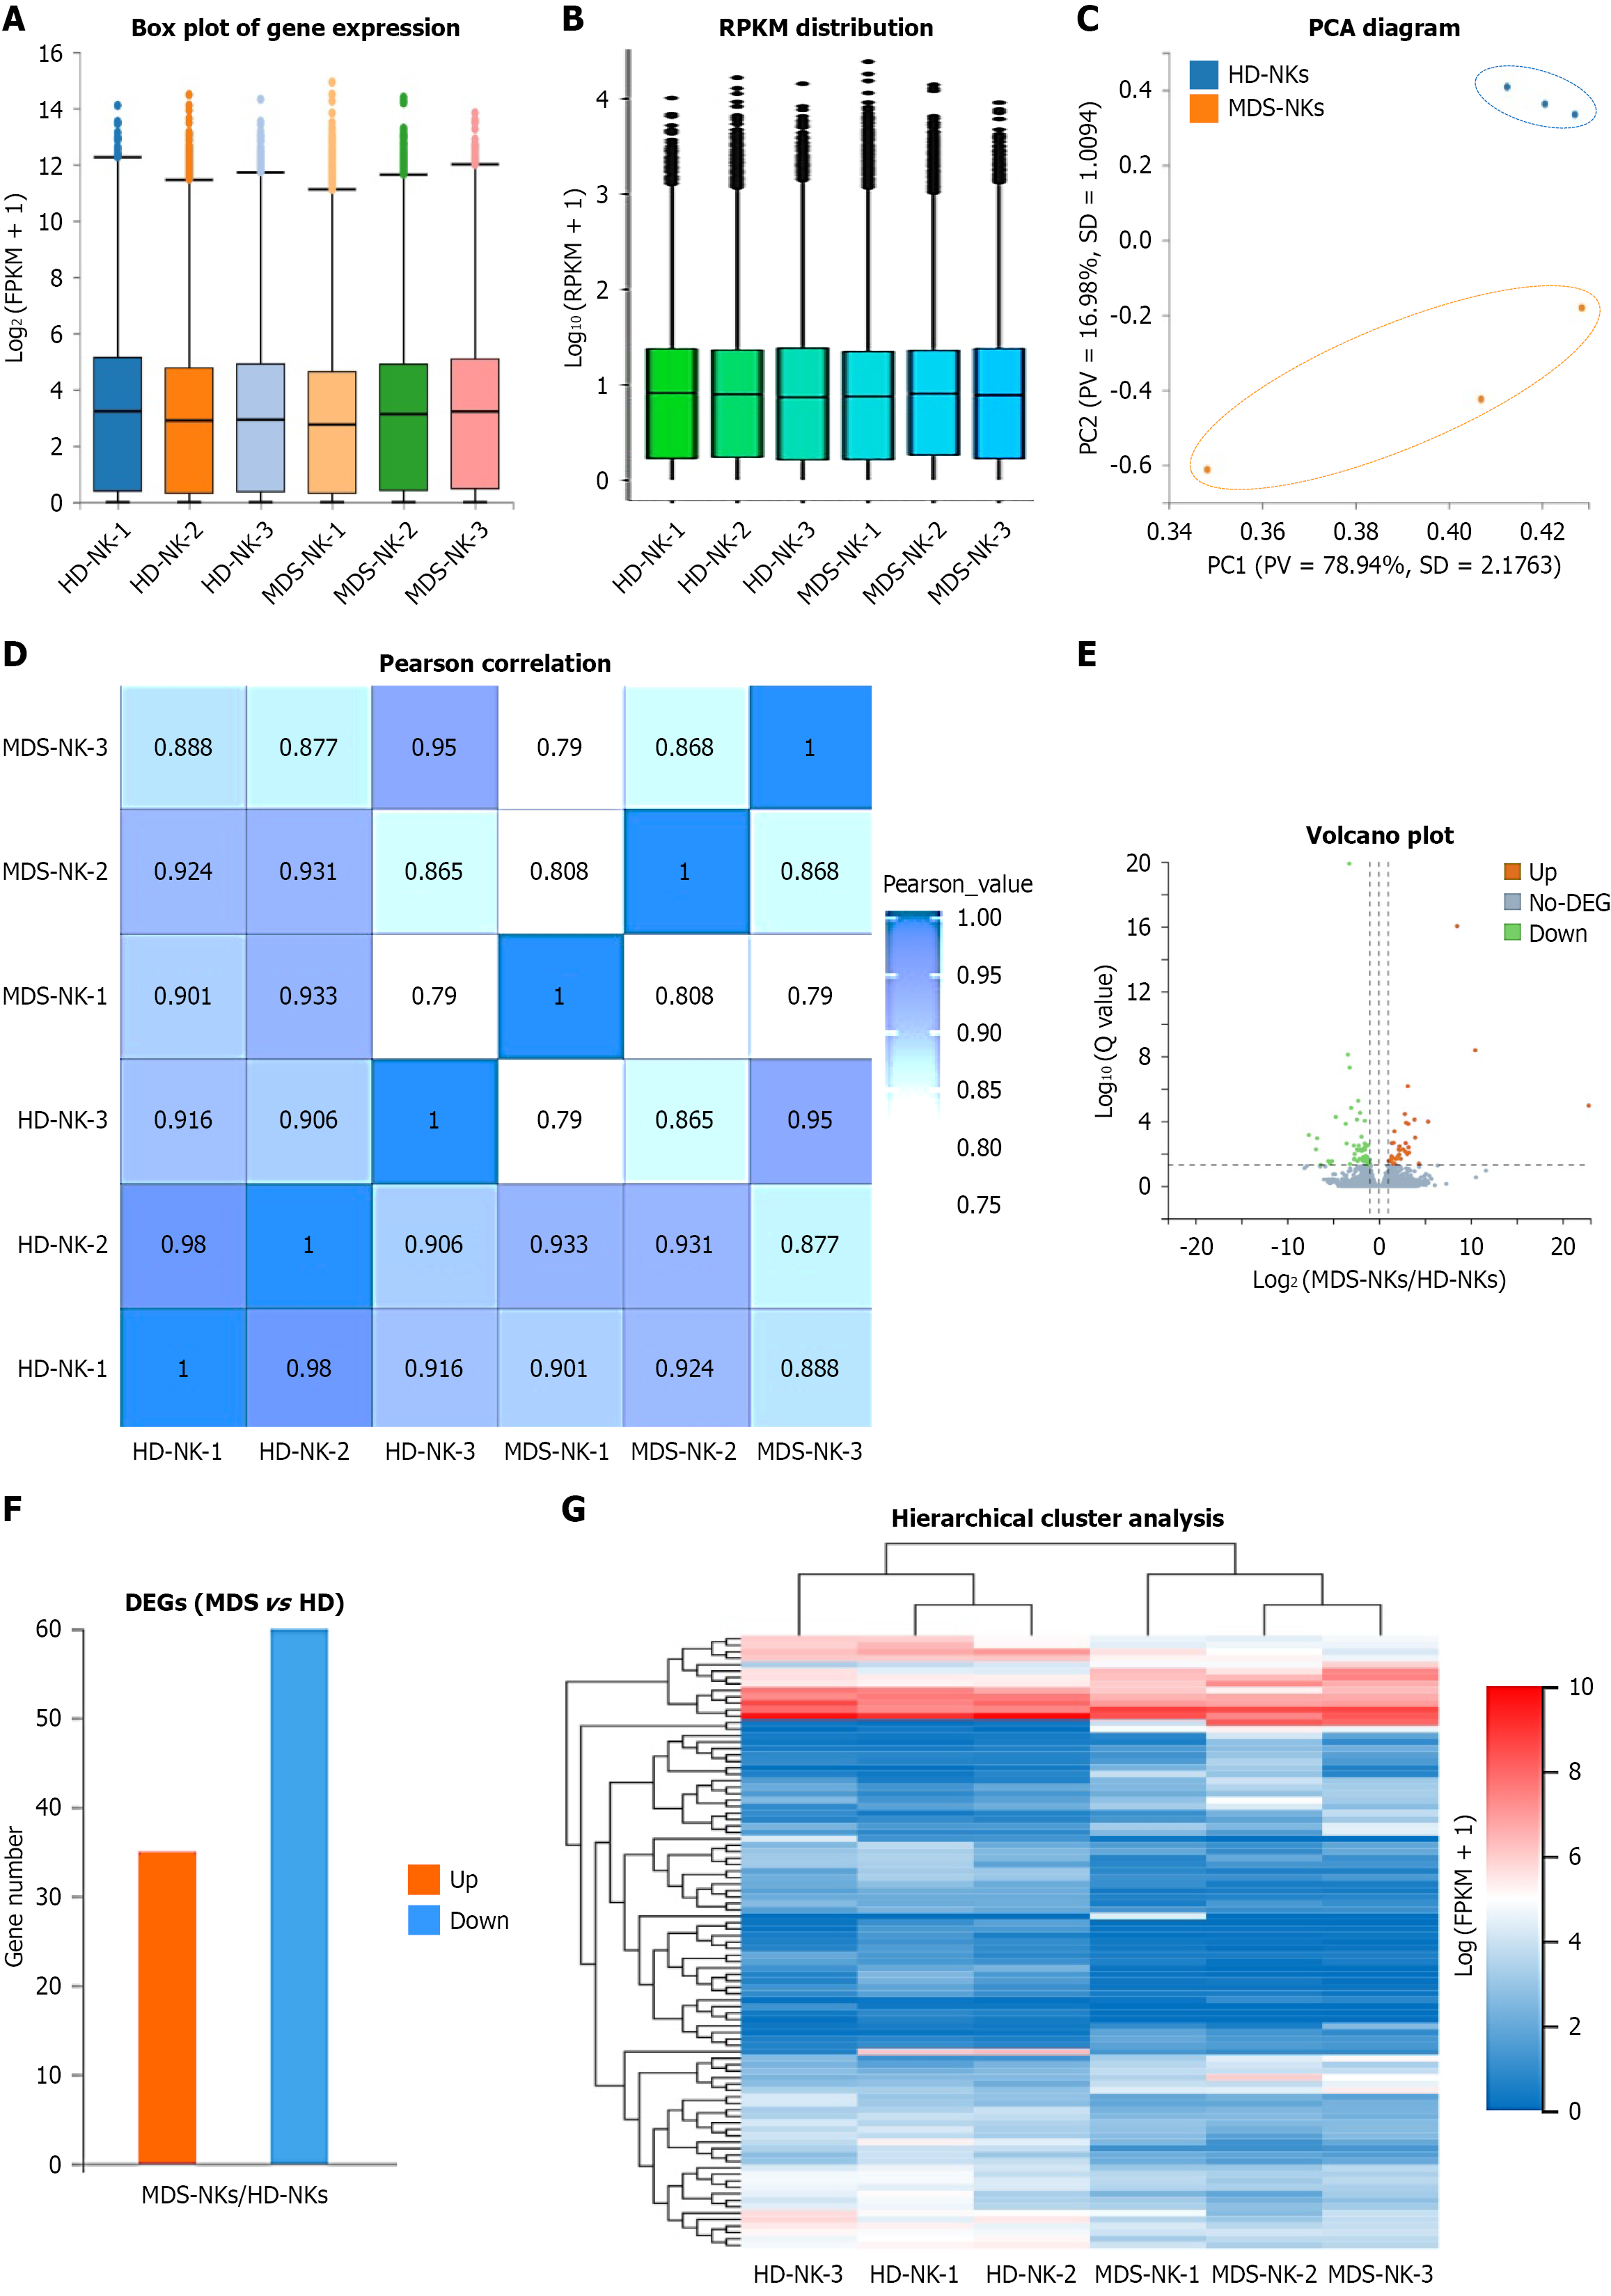
Figure 4 The gene expression pattern of expanded myelodysplastic syndrome natural killers and expanded healthy donor natural killers.
A and B: Box plot (A) and RPKM (short for Reads per Kilobase per Million mapped reads) diagram (B) showed the distribution of genes expression pattern in expanded myelodysplastic syndrome natural killers [myelodysplastic syndrome natural killers-1 (MDS-NKs-1), MDS-NK-2, MDS-NK-3] and expanded healthy donor natural killers [healthy donor natural killers-1 (HD-NK-1), HD-NK-2, HD-NK-3]; C and D: Principal components analysis (short for principal component analysis) and Pearson correlation analysis (D) of the indicated NK cells; E and F: Volcano plot diagram (E) and bar chart (F) showed the down-regulated differentially expressed genes (DEGs) (down), the up-regulated DEGs (up), and the non DEGs (no-DEG) between expanded myelodysplastic syndrome natural killers and expanded HD-NKs; G: HeatMap diagram revealed the hierarchical cluster pattern of DEGs between expanded myelodysplastic syndrome natural killers and expanded HD-NKs. MDS-NKs: Myelodysplastic syndrome natural killers; HD-NKs: Healthy donor natural killers; DEG: Differentially expressed genes.
- Citation: Liu SY, Feng XM, Chen ZY, Chen ZQ, Shang YR, Linnebacher M, Wang YX, Zhang SS, Cai M, Zhang LS. Characterization of the cellular and transcriptomic landscapes of natural killer cells in hematopoietic microenvironment of myelodysplastic syndrome. World J Clin Oncol 2026; 17(10): 126647
- URL: https://www.wjgnet.com/2218-4333/full/v17/i10/126647.htm
- DOI: https://dx.doi.org/10.5306/wjco.126647