
















Copyright: ©Author(s) 2026.
World J Clin Oncol. Oct 24, 2026; 17(10): 125345
Published online Oct 24, 2026. doi: 10.5306/wjco.125345
Published online Oct 24, 2026. doi: 10.5306/wjco.125345
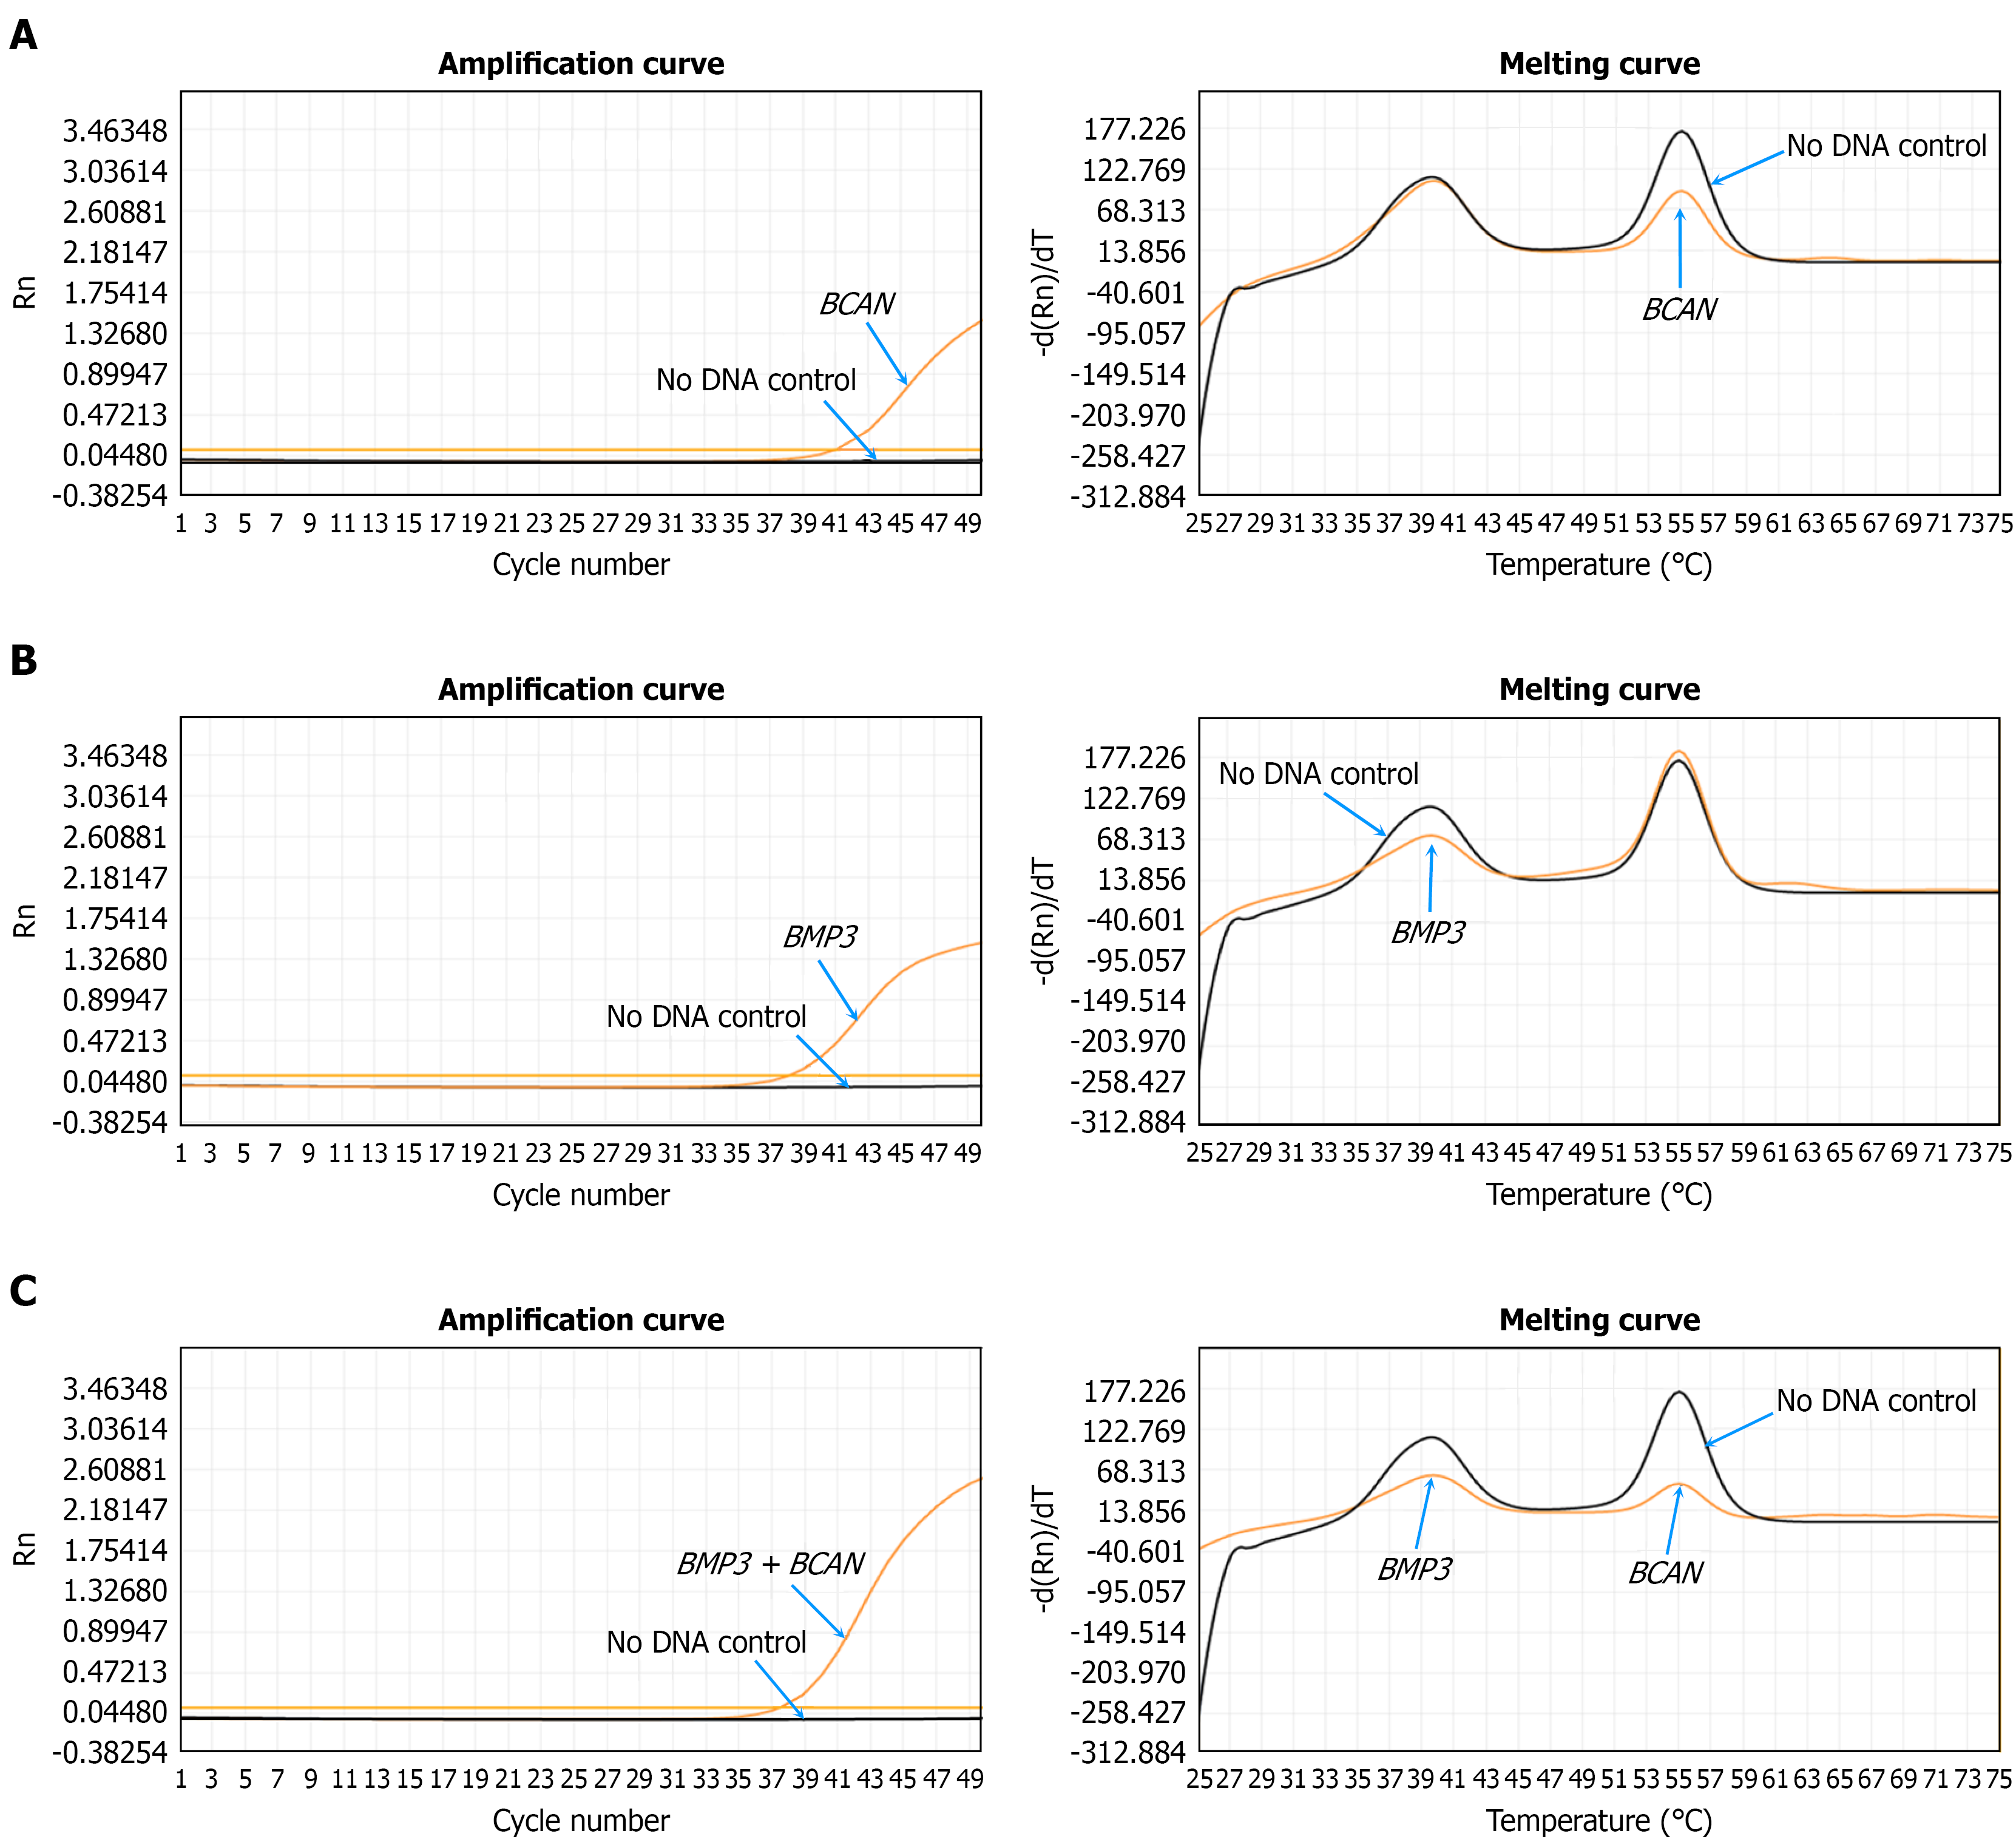
Figure 1 Example of multiplex probe amplification assay.
A: Graphic presentation of the amplification plot and melting curve showed that the signal was from BCAN; B: Graphic presentation of the amplification plot and melting curve showed that the signal was from BMP3; C: Graphic presentation of the amplification plot and melting curve showed that the signal was from BCAN plus BMP3.
- Citation: Liu ZF, Jiang JH, Huang WJ, Wang Y, Fan GW, Chen BG, Lan ZE, Xu LH, Cui CH. Plasma methylation markers for early colorectal cancer detection. World J Clin Oncol 2026; 17(10): 125345
- URL: https://www.wjgnet.com/2218-4333/full/v17/i10/125345.htm
- DOI: https://dx.doi.org/10.5306/wjco.125345