
















©The Author(s) 2026.
World J Clin Oncol. Jan 24, 2026; 17(1): 113304
Published online Jan 24, 2026. doi: 10.5306/wjco.v17.i1.113304
Published online Jan 24, 2026. doi: 10.5306/wjco.v17.i1.113304
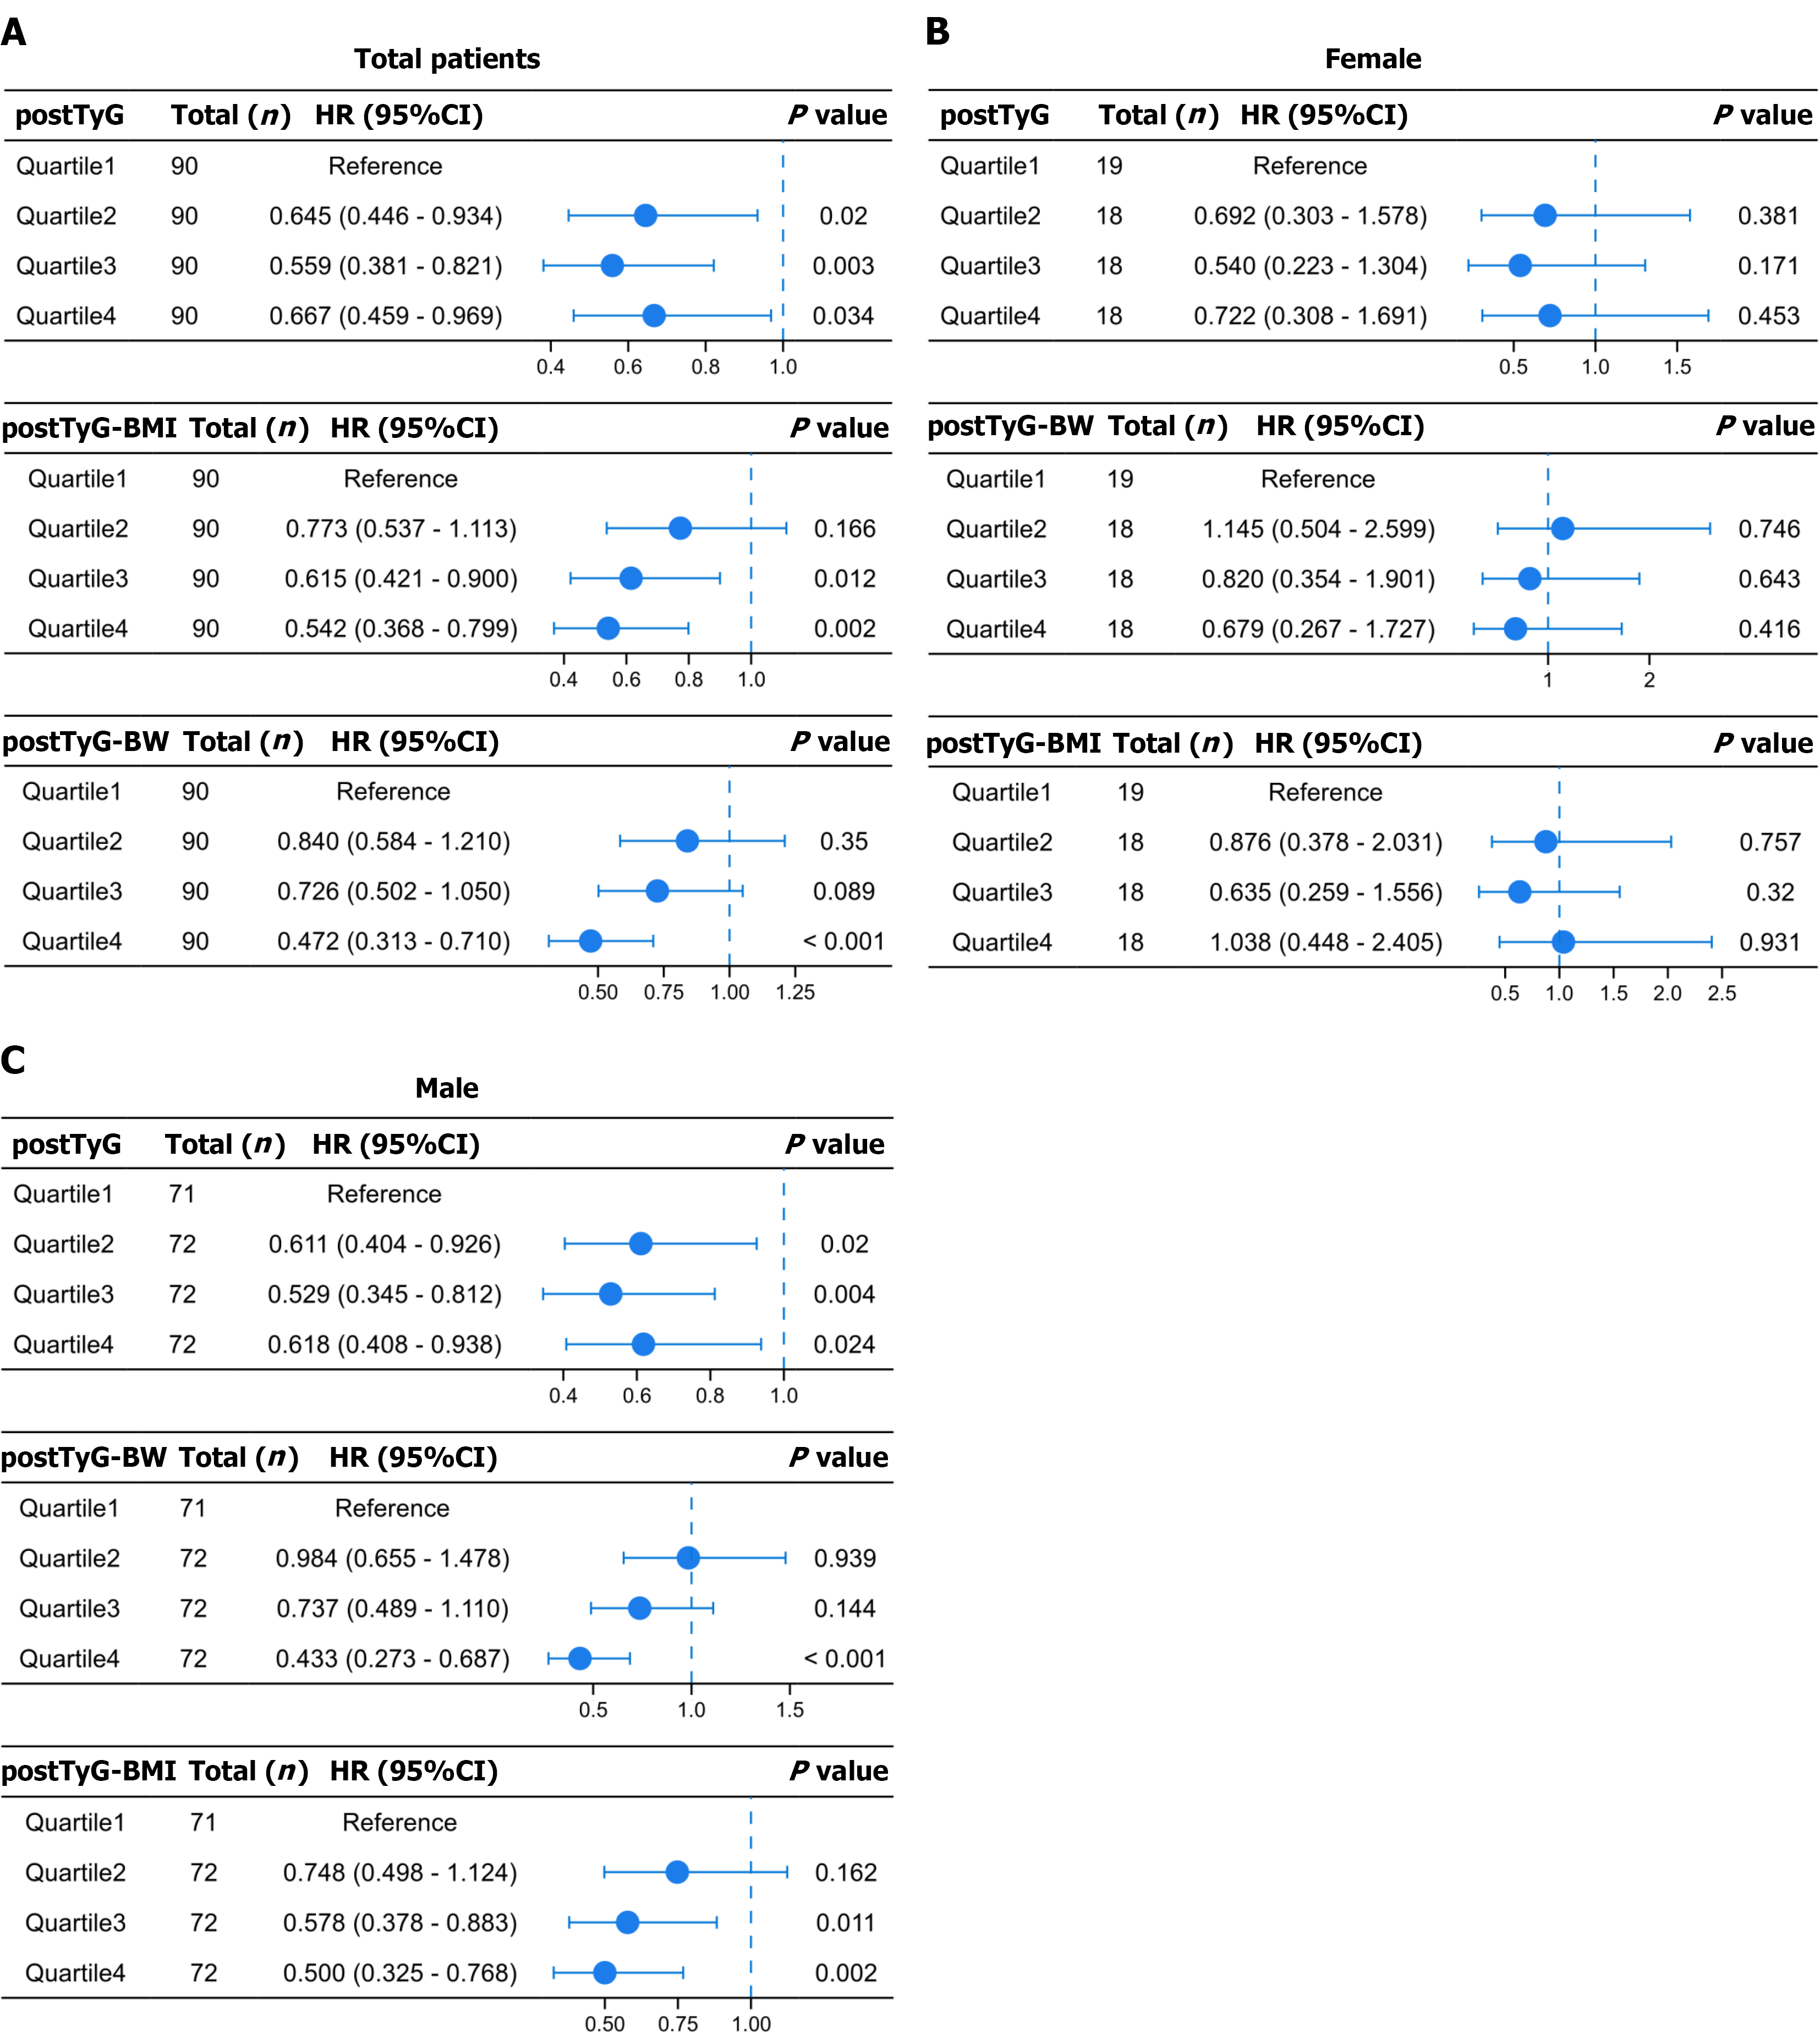
Figure 5 Forest plot analysis of the prognostic value of post-treatment triglyceride-glucose-related indices across subgroups.
Quartile 1 served as the reference, with hazard ratios, 95% confidence intervals, and P values presented. Analyses were adjusted for confounding factors including age, gender, Karnofsky Performance Status, smoking/alcohol history, tumor location, and chemoradiotherapy. A: Cox proportional hazards regression for quartiles in the total patient cohort; B: Female subgroup; C: Male subgroup. HR: Hazard ratio; CI: Confidence interval; postTyG: Post-treatment triglyceride-glucose; postTyG-BW: Post-treatment triglyceride-glucose-body weight; postTyG-BMI: Post-treatment triglyceride-glucose-body mass index.
- Citation: Xiao L, Liu YD, Zhang X, Zhang SC, Lyu JH. Post-treatment triglyceride-glucose index as survival protective factors in patients with esophageal squamous cell carcinoma. World J Clin Oncol 2026; 17(1): 113304
- URL: https://www.wjgnet.com/2218-4333/full/v17/i1/113304.htm
- DOI: https://dx.doi.org/10.5306/wjco.v17.i1.113304